
Implementing conversion rate optimization (CRO) methods increases the number of customer inquiries, boosting profitability for business websites and web applications. One of the key CRO solutions is heatmaps, which provide detailed information about visitor activity on web pages. In this article, you'll learn how to use heatmaps to optimize website conversion rate and what features the best heatmap tools offer in 2026.
Understanding Heatmaps
A heatmap is a data visualization method that provides a representation of how website visitors interact with specific elements. This analytics tool is often used to optimize a number of website performance metrics, primarily conversion rates.
A typical heatmap uses a warm-to-cold color scheme to depict user behavior and interactions with site components. Warm colors indicate the highest user activity and engagement, while cool colors indicate the lowest activity.
Today, several main types of heatmaps are used in web optimization:
- Click maps show the parts of the web interface (buttons, links, etc.) that users click most often. They help identify misclicks — attempts to click on unclickable elements, etc.
- Scroll maps show how far users scroll on a web page. They help identify where users most often stop browsing, optimize page length, and optimize content structure.
- Cursor maps track cursor movements across the interface. They help identify areas of the site where users focus their attention and spend most of their time.
Heatmaps are considered one of the most effective solutions for website CRO because they capture the actual behavior of visitors. Using them helps:
- Make your web interface more user-friendly and intuitive. Heatmaps provide insight into the effectiveness of various interface elements, including content layout, call-to-action (CTA) text and design, color schemes, and more. They help you understand how these elements influence visitor behavior and optimize them for increased conversion.
- Reduce bounce rates. These tools help identify distracting and unused website elements, correctly position more important components, minimize navigation gaps, and identify and eliminate audience churn points. This will ultimately reduce bounce rates and increase conversions.
- Test the effectiveness of a website redesign. Using heatmaps in A/B testing helps compare audience activity and engagement with individual web interface elements before and after the redesign. These heatmaps allow you to evaluate the effectiveness of your changes and gain valuable insights for further optimization.
Hotjar
Source: hotjar.com
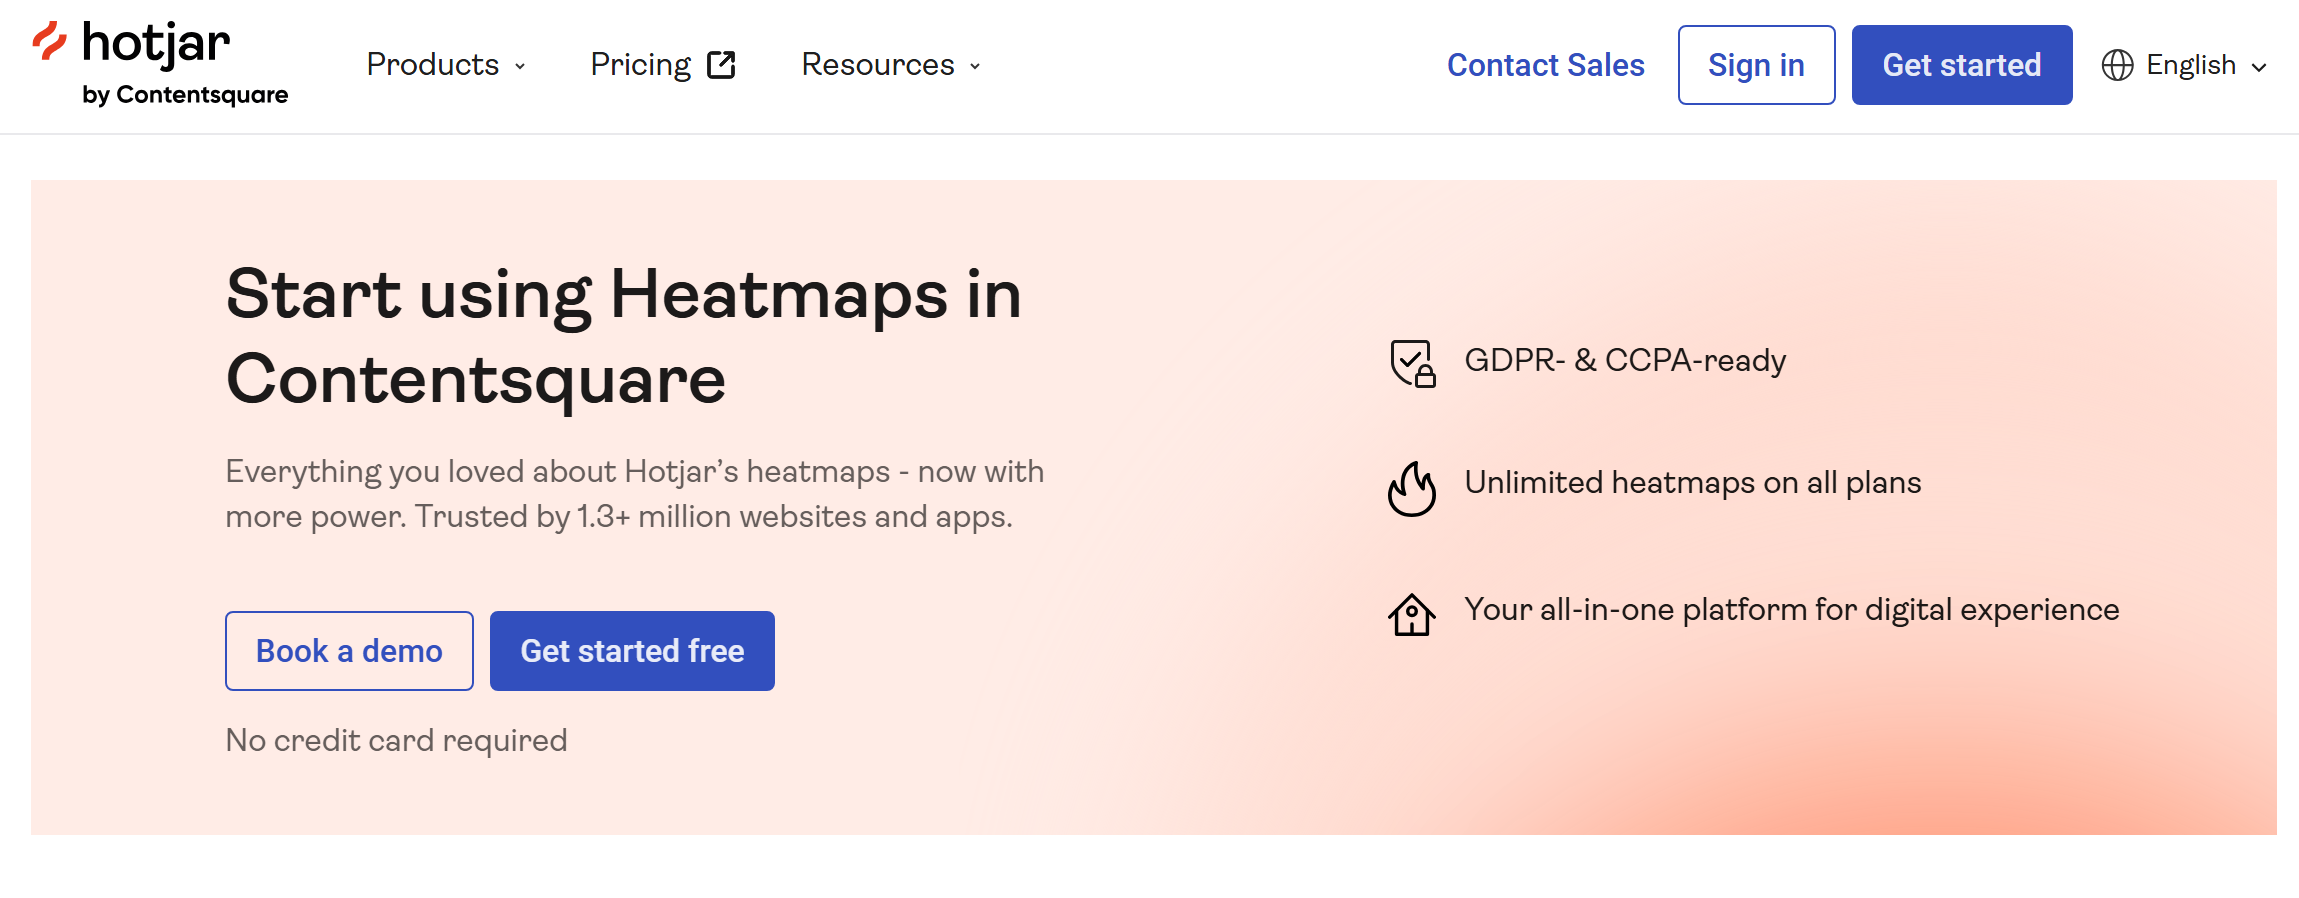
Hotjar is widely recognized as an industry leader in behavioral analytics. It offers marketers and website owners a powerful suite of heatmap and data visualization solutions designed to uncover exactly how visitors interact with their pages.
Key features:
- Click, scroll, and move maps provide detailed insights into how users interact with websites and web pages. They can be used to identify high-activity zones, dead zones, misclicks, scroll depth, and other important metrics.
- Session recording allows you to record visitor activity in detail, including all their movements and actions. The resulting data can provide valuable insights for optimizing various web interface elements.
- Device-specific heatmaps allow you to segment user behavior data by device type: smartphones, tablets, desktops.
- Page-based heatmaps help collect and process information about user activity on specific web pages or groups of pages. This allows for effective A/B testing and the identification of common trends across similar web pages.
- Hotjar allows you to filter heatmap data by a number of criteria: device types, traffic sources, session properties, and previous user activity (new vs. returning).
- Among the platform's popular website analytics tools, surveys (a built-in feedback widget is available) and funnels are worth highlighting. The latter help measure conversion rates and provide recommendations for website optimization.
Hotjar is now part of the ContentSquare platform, and its pricing structure has been integrated into the broader ContentSquare ecosystem:
- Free (1 project, replays, heatmaps and funnels, performance and error monitoring, basic surveys, LLM integration).
- Growth (all Free options + 13 months of data history storage, 3 projects, zone-based heatmaps, visitor path analysis, AI assistant, etc.) — from $49/month.
- Pro (all Growth options + 6 projects, advanced filtering, multi-session summary, revenue tracking, etc.) — price upon request.
- Enterprise (all Pro options plus custom number of sessions, unlimited projects, experience monitoring, error summaries, data feeds, dedicated support, etc.) — price upon request.
Crazy Egg
Source: crazyegg.com
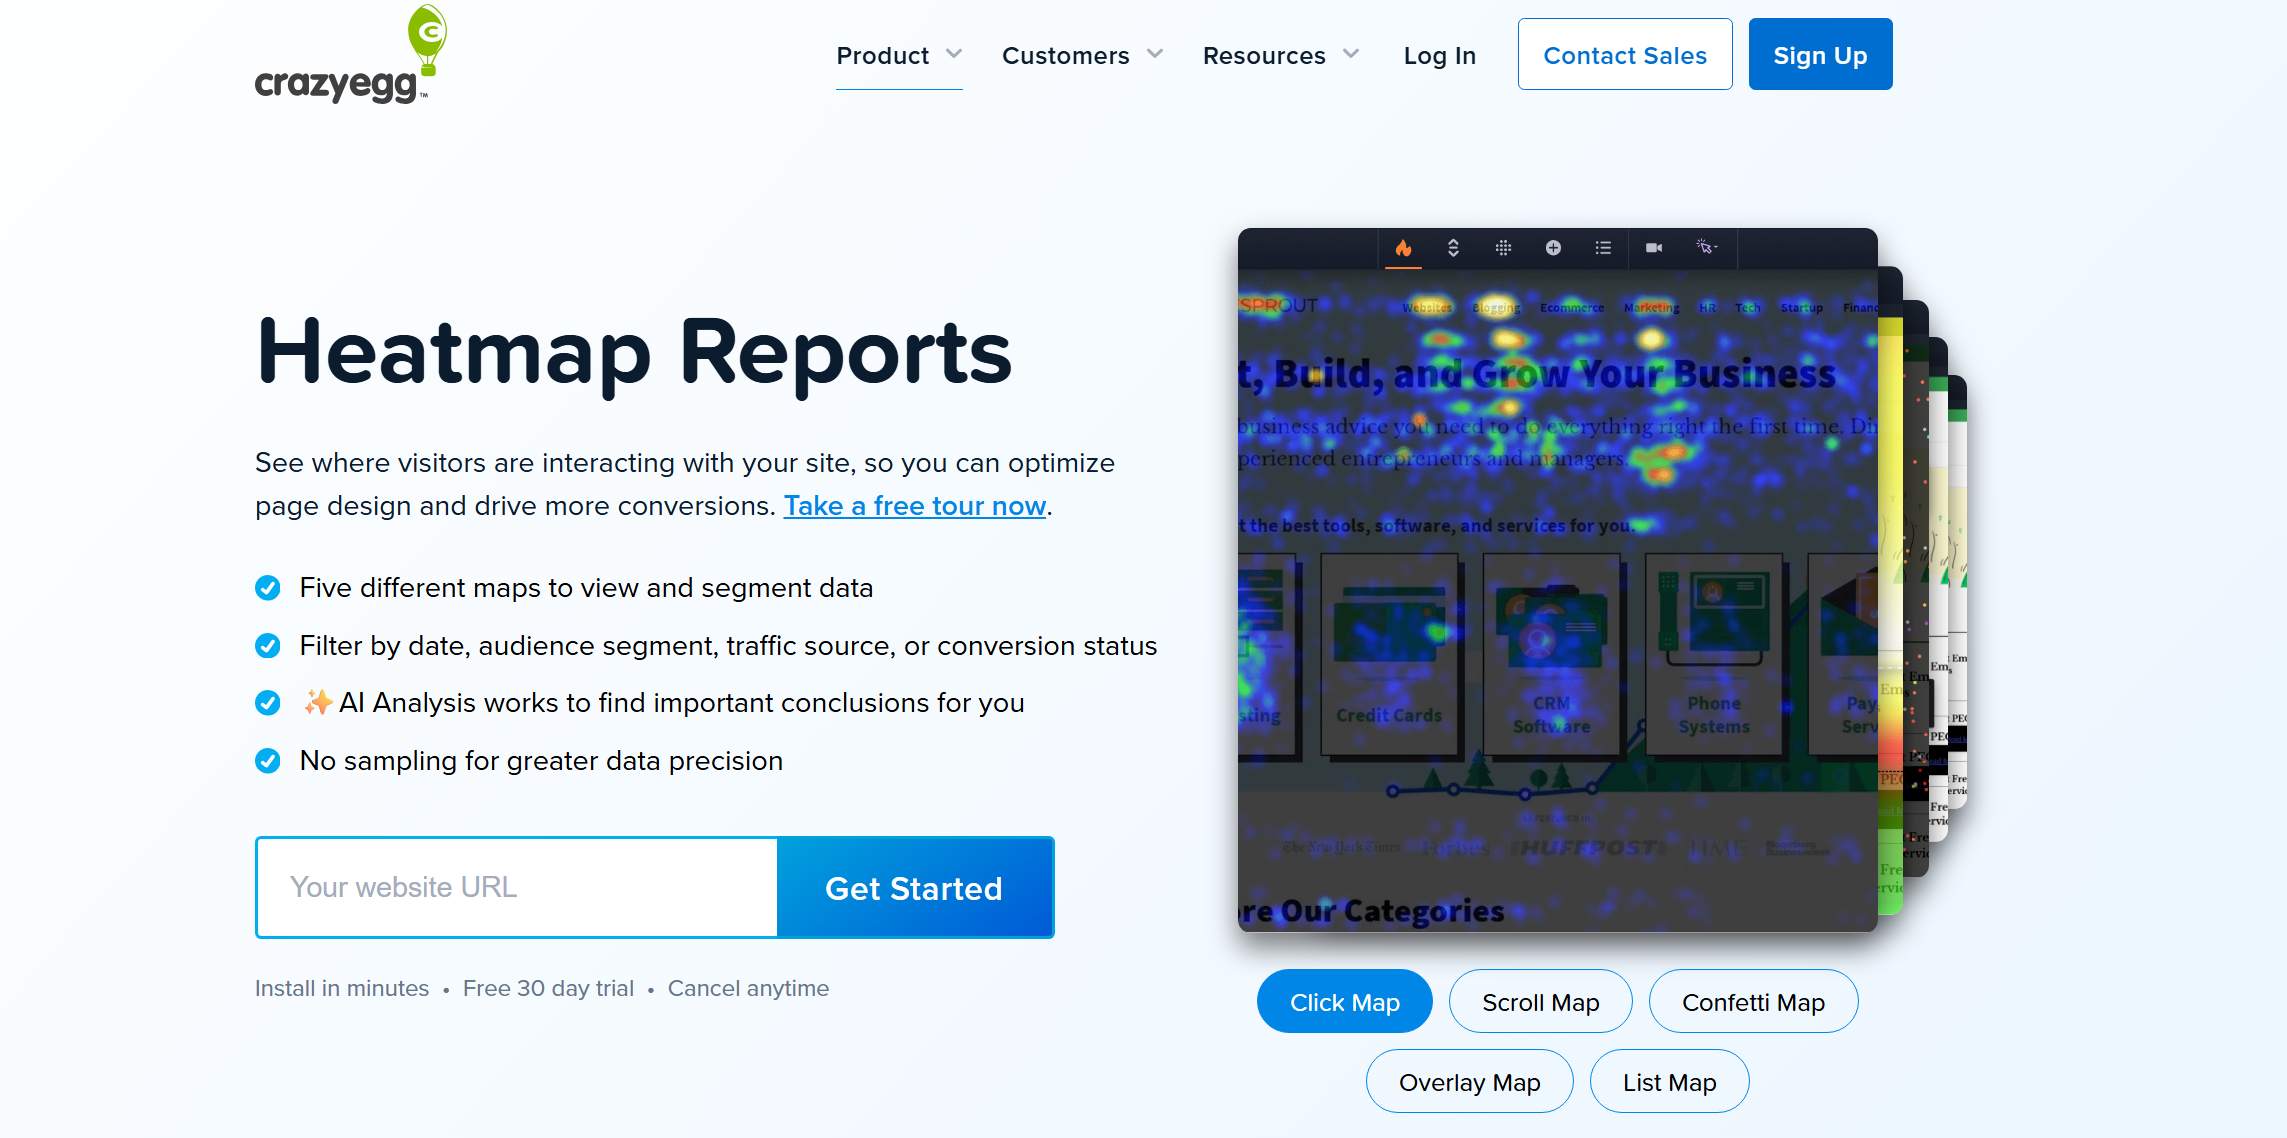
Crazy Egg is a popular platform with a set of advanced UX heatmap tools for analyzing user behavior and optimizing website conversion rates. The service combines heatmaps, session recordings, and CRO solutions, helping identify problematic interface elements and improve user experience based on real data.
Key features:
- The service allows you to track visitor activity in a variety of ways, including click and scroll maps, Confetti reports with click segmentation by traffic source, device, and other criteria, and Overlay reports with click sorting by individual web page elements.
- Crazy Egg lets you monitor both entire websites and individual pages (snapshot-based tracking). This allows you to analyze user actions (clicks, scrolls, engagement, etc.) in detail and create multiple heatmaps for different pages, landing pages, and funnels.
- Instant heatmaps let you quickly analyze any website without any configuration or customization. The service automatically generates heatmaps with up-to-date data based on recent traffic, helping you quickly identify and fix key issues.
- Advanced filtering and segmentation options allow you to sort heatmap data by a variety of criteria, including device type (desktop, mobile), traffic source, UTM parameters, user segments, date range, and more.
- The platform's session recording tools allow you to view real user sessions and analyze their behavior on the site, including clicks, scrolling, and interactions with page elements. This data helps identify user experience issues and identify areas for conversion improvement, along with heatmaps and other analytics features.
- It's possible to compare multiple heatmaps: those created over different time periods, for different page versions, devices, etc. This is useful for A/B testing and other CRO experiments.
- Built-in AI algorithms automate the analysis of heatmap results, identify important patterns, and generate data-driven insights.
Crazy Egg pricing is available in four plans:
- Starter (5,000 tracked pageviews, 50 session recordings, 5 heatmap reports, 6 months of history storage) — $29 per month.
- Plus (150,000 tracked pageviews, 1,000 session recordings, 75 heatmap reports, 2 years of history storage, unlimited A/B testing, error, conversion, and CTA tracking) — $99 per month.
- Pro (500,000 tracked pageviews, 5,000 session recordings, 100 heatmap reports, 2 years of history storage, unlimited A/B testing, error, conversion, and CTA tracking, unlimited surveys, domains, etc.) — $249 per month.
- Enterprise (1,000,000 tracked pageviews, 10,000 session recordings, 200 heatmap reports, 2 years of history storage, unlimited A/B testing, error, conversion, and CTA tracking, unlimited surveys and domains, SAML SSO, training, and onboarding) — $599 per month.
Microsoft Clarity
Source: clarity.microsoft.com
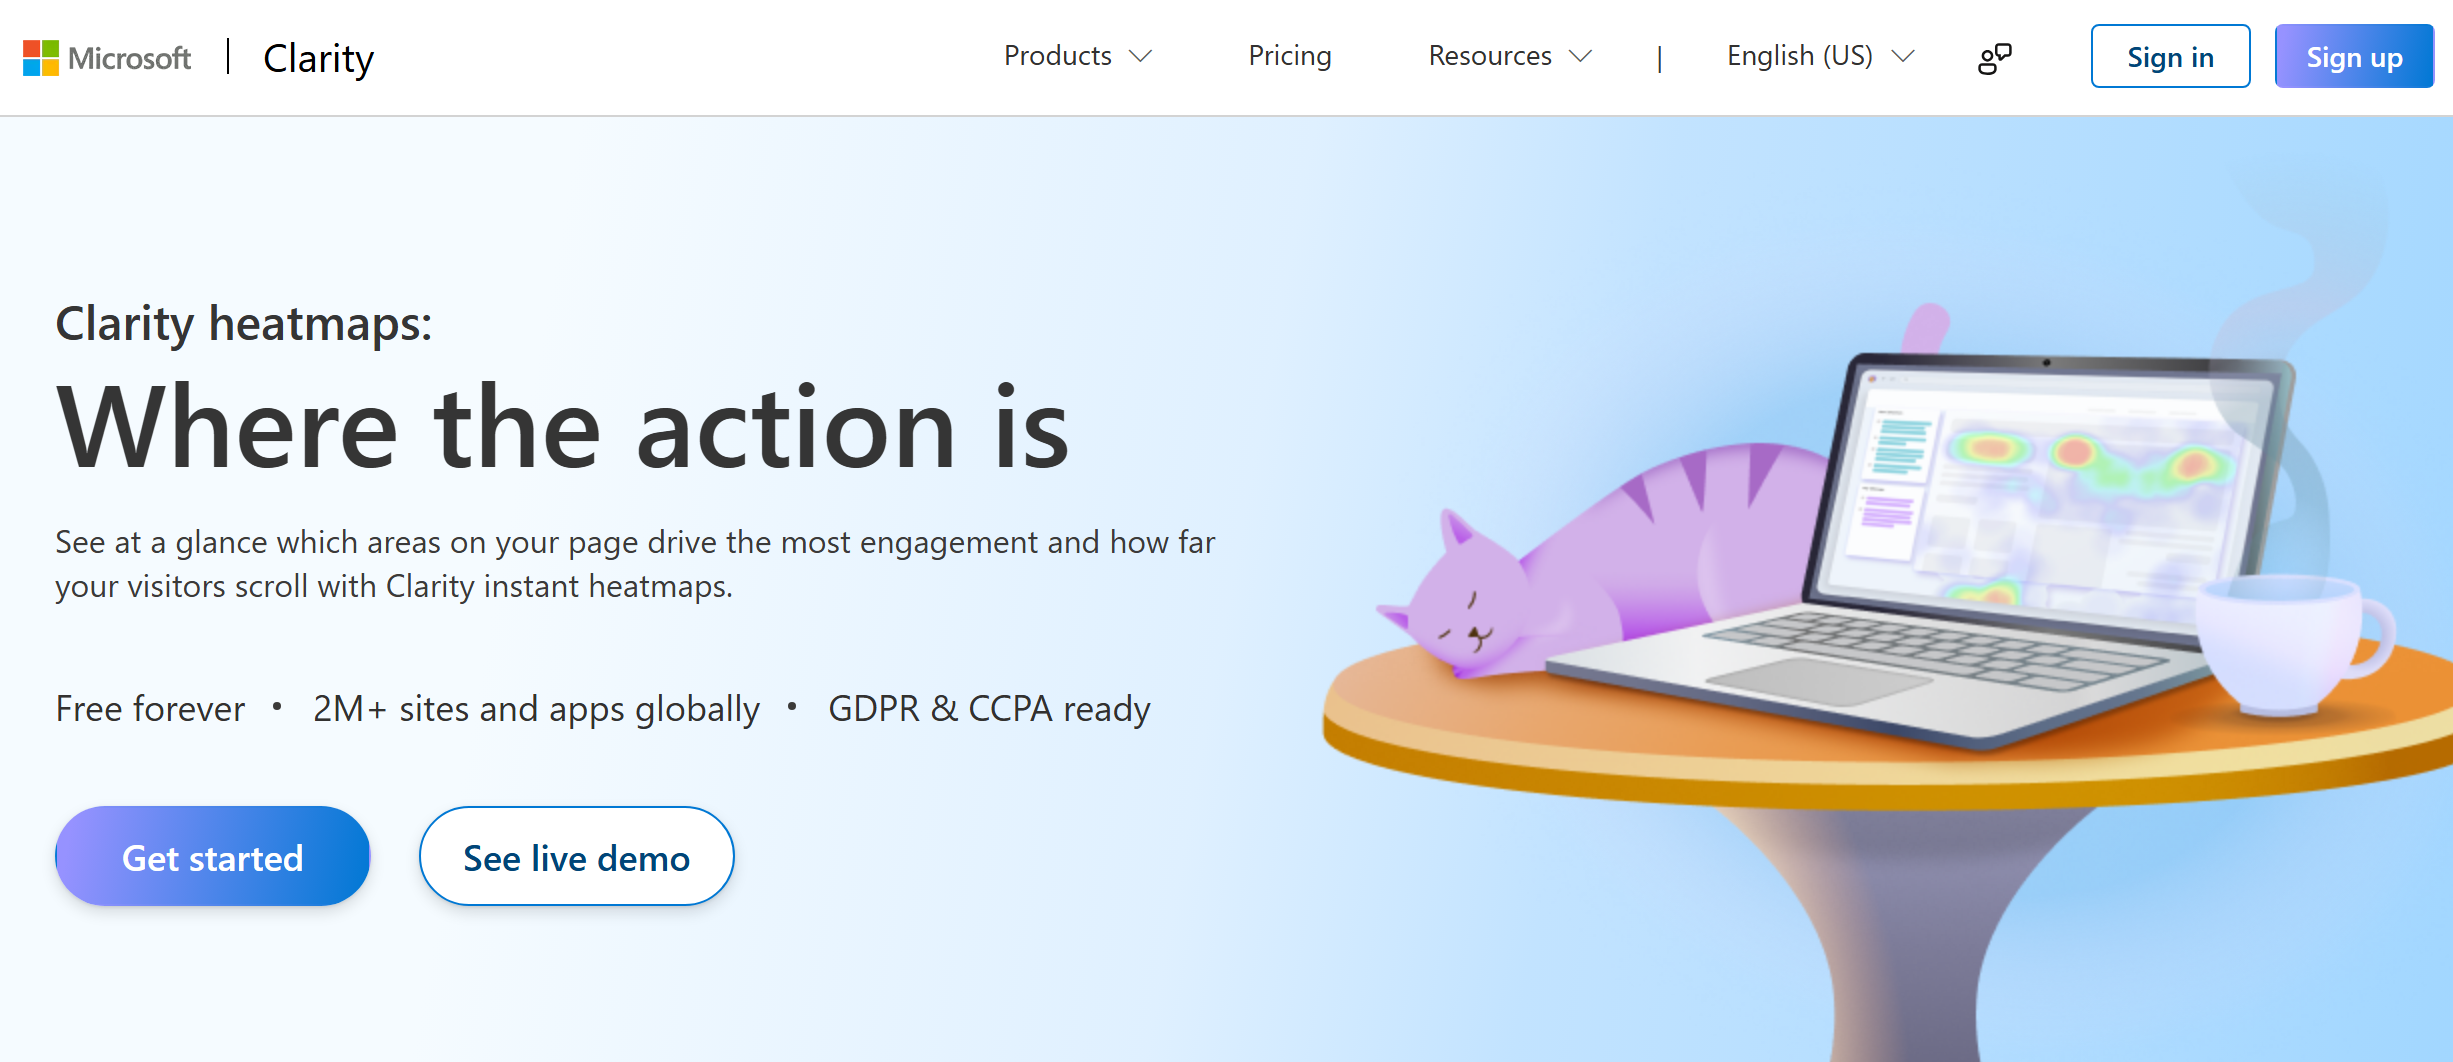
Microsoft Clarity is a free web analytics and behavioral analysis service in the website heatmap tools category. The platform combines heatmaps, session recordings, and AI analytics to help identify user experience bottlenecks and conversion growth opportunities.
Key features:
- The service offers various types of heatmaps: from standard click and scroll maps to more complex area and attention maps, as well as conversion maps (which show which website elements drive conversions; available only for Shopify websites).
- Element-based click tracking (instead of X/Y coordinate tracking) links clicks to HTML elements, improving the accuracy of heatmaps (especially for responsive layouts and dynamic pages).
- Scroll heatmaps show how far users scroll down a web page. They can be used to calculate the percentage of visitors who reach a particular section of the site, identify churn points, and more.
- Clarity supports filters and segmentation for more efficient heatmap processing. Filtering is available by URL, audience segments, device types, as well as tags and custom parameters.
- Native support for Copilot's AI assistant enables automatic analysis of heatmap data, identifying trends in user behavior and generating personalized data-driven summaries.
- Using AI, you can answer questions about heatmaps, compare results across multiple campaigns, and automate onboarding with built-in support options.
Mouseflow
Source: mouseflow.com
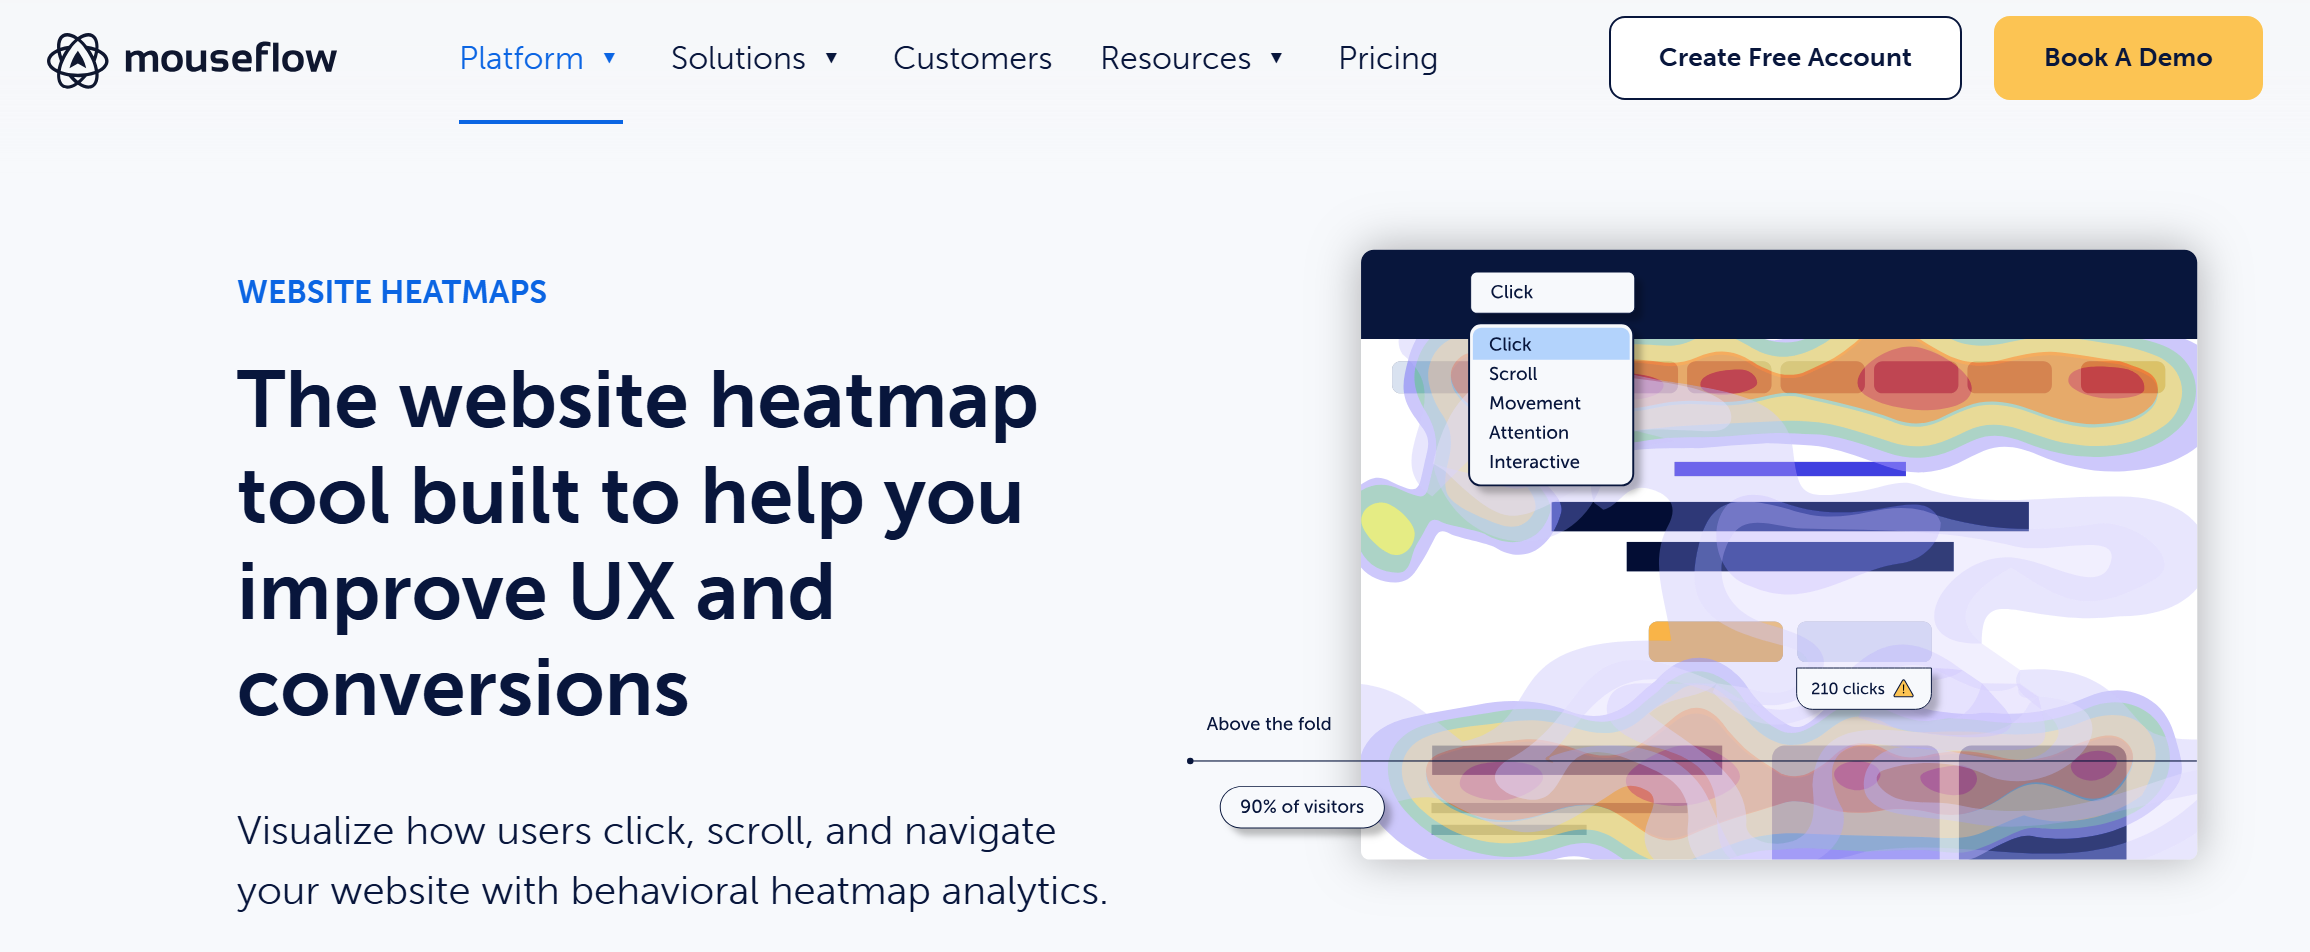
Mouseflow is a web analytics and behavioral analysis service that integrates various user behavior analytics tools (heatmaps, session recordings, funnel analysis, forms, and surveys) to study user interactions and collect feedback. The platform helps analyze user scenarios in detail and identify the points that influence conversion and interface usability.
Key features:
- Website owners and marketers can analyze visitor activity using seven types of heatmaps: clicks, scrolling, cursor tracking, attention, friction, location, and interactive maps. The latter show user interactions with dynamic interface elements.
- Click tracking tools visualize data on clicks and other interactions. This allows you to identify factors that reduce conversion, such as weak CTAs, unclickable elements that should be clickable, and other factors that negatively impact website usability.
- Mouseflow allows you to filter and sort heatmap data based on a range of audience attributes: device type (smartphone, tablet, desktop), traffic source (down to a specific campaign), user behavior patterns, and more.
- Heatmaps can be used in conjunction with other web analytics features. Combining them with session recordings, user journey maps, form analytics, and funnels allows for even more accurate and effective website conversion optimization.
- The native Mina AI assistant generates insights based on collected data and automates a number of operations.
- The service supports integrations with 40+ third-party systems, including Google Analytics, Google Ads, Shopify, Salesforce, Microsoft Teams, Slack, Webflow, WooCommerce, and more.
Mouseflow offers a pricing structure with five plans:
- Free (500 sessions per month, 1 site, 1 funnel, 1 month of data storage, unlimited users, session recordings, click, scroll, and location maps, data filtering and segmentation, integrations, etc.).
- Essential (5000 sessions, all Free features + 3 months of data storage) — $39/month.
- Advanced (25,000 sessions, all Essential features + 2 sites, 5 funnels, 6 months of data storage, feedback surveys, mouse, attention, friction, and interactive maps) — $149/month.
- Premium (100,000 sessions, all Advanced features + 5 sites, 10 funnels, 12 months of data storage, form analytics, data export, REST API) — $399/month.
- Enterprise (custom number of sessions/sites/funnels/data retention period, all Premium features plus user journey analysis, SSO, custom privacy settings, dedicated account manager, priority support) — price upon request.
Lucky Orange

Source: luckyorange.com
The Lucky Orange platform rounds out our review of conversion optimization tools. One of its distinctive features is the combination of heatmaps and session recordings with integrated live chat. This allows you not only to analyze visitor behavior but also to interact with them in real time while they're on the site.
Key features:
- The service uses dynamic heatmaps that are automatically updated in real time as new data is received. This helps marketers and website owners quickly track changes in visitor behavior without the need for lengthy data accumulation.
- Lucky Orange supports the three most common heatmap formats: click maps, scroll maps, and cursor maps. Using them together, you can obtain the most accurate and detailed information about user activity trends and churn points.
- The service helps track visitor interactions with both static and dynamic web page elements: pop-ups, drop-down menus, sliders and carousels, dynamically updating content, etc.
- The service's algorithms are capable of handling most modern web architectures, including single-page web applications, dynamic URLs and page states, React/AJAX-enabled sites, and more.
- Advanced segmentation and filtering options allow you to sort heatmap data by a variety of criteria, including device types, traffic sources, user geolocation, campaign/UTM parameters, new or returning visitors, and more.
- Discovery AI automatically collects and analyzes data from heatmaps, funnels, and session recordings, tracking all clicks, scrolls, sessions, and forms. This allows the AI assistant to generate data-driven insights and answer questions based on the most relevant information.
Lucky Orange offers six pricing plans:
- Build (up to 3500 sessions per month) — $39.
- Grow (up to 10,000 sessions per month) — $89.
- Expand (from 50,000 sessions per month) — $249.
- Scale (from 300,000 sessions per month) — $1049.
- Enterprise (from 700,000 sessions per month) — price upon request.
Conclusion
The heatmap software presented in our article provides marketers, website owners, SEOs, and entrepreneurs with a set of powerful tools for CRO. These solutions offer businesses extensive capabilities for analyzing audience behavior, as well as assessing the usability, content quality, and other parameters of their web resources. Using heatmap services, website owners and administrators can effectively troubleshoot technical issues, improve user experience, and take other important steps to improve conversion rates.
Please note: Software pricing and subscription tiers are subject to frequent updates. Always cross-check details on the official websites before making a purchasing decision.