Low conversion rates can limit the return businesses get from their existing traffic and marketing investment. Conversion rate optimization (CRO) addresses this problem through behavioral analysis, structured experimentation, and user experience improvements. This article covers the fundamentals of CRO, from identifying friction in the conversion funnel and developing evidence-based hypotheses to running reliable tests and improving high-impact UI/UX elements.
Defining the Core Principles of CRO
Conversion rate optimization (CRO) is a systematic process for increasing the percentage of users or visitors who complete a desired action. Depending on the business, a conversion might be a purchase, lead form submission, account registration, trial signup, or newsletter subscription.
CRO helps businesses get more value from existing traffic instead of relying solely on attracting more visitors. Before making changes, teams should establish a baseline and define how the conversion rate will be calculated. A common formula is:
Conversion rate = (number of conversions ÷ number of eligible users or sessions) × 100
The appropriate denominator depends on the measurement context, so it should remain consistent when results are compared across experiments.
Effective CRO requires a clear understanding of what users are trying to accomplish, where they encounter friction, and which changes are most likely to improve their experience. The following principles provide a practical starting point.

Understand your users
Before trying to influence a target action, learn what users expect, what motivates them, and what prevents them from moving forward. Combine behavioral evidence from heatmaps, click maps, and session recordings with direct feedback from surveys, interviews, and contextual feedback forms.
Define goals and hypotheses
Clearly defining goals and hypotheses for tests and experiments is a key factor in campaign success. Each hypothesis should be supported by relevant data (both qualitative and quantitative). This will help you set measurable goals for your CRO activities and accurately interpret the results.
Optimize the conversion funnel
Examine each stage that leads to the desired action, including landing pages, lead forms, product selection, checkout, follow-up emails, and onboarding where relevant. Look for unnecessary steps, unclear transitions, inconsistent messaging, and mismatches between ads and landing pages.
Don't forget about micro-conversions
Macro-conversions are the primary outcomes tied to a business objective, such as completed purchases, qualified lead submissions, or trial registrations. Micro-conversions are meaningful intermediate actions that indicate progress toward that outcome, such as viewing a product page, adding an item to the cart, starting a form, or downloading a price list. The distinction depends on the goal: a newsletter signup, for example, may be a micro-conversion in one funnel and the primary conversion in another.
Find the right CRO tools
Specialized tools can support different stages of CRO. Behavioral analytics platforms such as Hotjar and Microsoft Clarity help reveal how users interact with pages, while VWO, Optimizely, and AB Tasty support controlled experiments. When choosing a platform, consider your traffic volume, the types of tests you plan to run, privacy requirements, and compatibility with your analytics and data stack.
Data-Driven Analysis and User Behavior Insights
An effective CRO strategy starts with evidence rather than guesswork. Quantitative data shows where users drop off or behave differently than expected, while qualitative research helps explain why. Together, these sources can reveal friction points and guide testable hypotheses.
A practical analysis process moves from defining the desired outcome and validating the tracking setup to examining the funnel, segmenting users, and investigating the barriers behind observed behavior.
Set goals and prepare tools
Start by defining a primary outcome and the metrics that will show whether it improves. In GA4, important actions such as purchases, lead submissions, demo requests, and trial registrations can be marked as key events. Supporting metrics can track meaningful progress toward the main outcome, including product views, add-to-cart actions, video completions, and form starts.
Next, verify that each event is recorded consistently. Google Analytics 4 can collect event data from websites and apps. After the required container code has been installed, Google Tag Manager can deploy and manage many tags through its web interface, although custom events and data-layer implementations may still require development work.
Analyze quantitative data
Analyzing quantitative data helps you identify problem areas that negatively impact conversion rates. First, analyze three key aspects:
- Conversion funnel. Map the sequence relevant to the target action. For an online store, this might run from the landing page to the product page, cart, checkout, and payment. A lead-generation funnel may instead end with a form submission and confirmation. Measure progression and drop-off at each stage to identify where users encounter friction.
- Segmentation. Analyze user segmentation criteria relevant to your business: location, traffic source, devices, campaigns, etc. Conversion issues often arise only in certain segments.
- Behavioral paths. Use GA4 Path Exploration to examine the pages, screens, and events users encounter before or after a selected point. This can reveal common routes, unexpected exits, and looping behavior that may indicate users are getting stuck. Path data shows what users did, so combine it with qualitative research to understand why.
Analyze qualitative data
Qualitative research helps explain the reasons behind patterns found in analytics. Useful methods include:
- Heatmaps and scroll maps. Use these visualizations to see where users click, tap, and stop scrolling. Hotjar supports websites and web-based applications, while Microsoft Clarity offers tracking for both websites and supported mobile app implementations.
- Session recordings. Review session replays to identify confusing interactions, repeated errors, and points where users abandon a process. Before collecting recordings, ensure that the setup follows applicable consent requirements and hides or excludes any content that should not be captured.
- Surveys and feedback forms. Ask concise questions at relevant stages of the journey to learn what prevented users from continuing, what information they could not find, or why they decided not to complete an action.
Identify barriers to conversion
Conversion rates are often reduced by the following factors:
- Usability issues. Slow loading times, poor mobile usability, long forms with complex questions, poorly designed calls to action (CTA).
- Trust issues. Insufficient reviews, unconvincing benefits, weak guarantees, unclear pricing, lack of evidence of reliability and security.
- Motivation issues. Lack of urgency, weak value proposition, ineffective or absent differentiation.
The Iterative Framework of A/B and Multivariate Testing
A/B and multivariate testing turn CRO hypotheses into measurable experiments. An A/B test compares a control with a variation of a defined experience, while a multivariate test evaluates combinations of changes across several elements. Reliable results require clear metrics, an appropriate sample size, consistent audience assignment, and an analysis plan defined before the experiment begins.
Use the following workflow:
- Identify the problem. Use platforms such as Google Analytics 4, Hotjar, Microsoft Clarity, or Mixpanel to find evidence of friction. Relevant signals may include funnel drop-offs, low CTA click-through rates, form errors, cart abandonment, or low engagement within an important audience segment. Treat these patterns as starting points for investigation rather than proof of a cause.
- Write a testable hypothesis. State what will change, why it may affect behavior, and which primary metric will be used. For example: “Replacing the generic CTA ‘Submit’ with ‘Get a free quote’ will increase CTA clicks because the new wording communicates the benefit more clearly.”
- Create the variations. For an A/B test, prepare a control and a variation that reflects the hypothesis. Avoid unrelated changes when you need to attribute the result to a specific element. In a multivariate test, define variations for several elements and remember that the number of combinations can grow quickly.
- Define and run the experiment. Specify the eligible audience, traffic allocation, primary and guardrail metrics, minimum detectable effect, required sample size, and stopping rules. Assign users randomly, keep each user in the same variation, and run the versions concurrently to reduce time-based bias.
- Evaluate and document the results. Follow the statistical method used by the experimentation platform. Do not declare a winner solely because one variation has the highest observed conversion rate. Check whether the required sample or stopping criteria have been met, assess statistical uncertainty and practical impact, and review guardrail metrics for negative side effects. Document both successful and inconclusive results.
A/B testing is generally the more practical choice when you need to evaluate one focused change or compare two coordinated experiences. It is easier to interpret and usually requires less traffic than a multivariate experiment.
Use multivariate testing when you need to understand how changes to several elements interact and you have enough traffic and conversions to test all relevant combinations. It can reveal which combination performs best, but splitting traffic across many versions usually increases the time and resources required.
Optimizing High-Impact UI/UX Elements
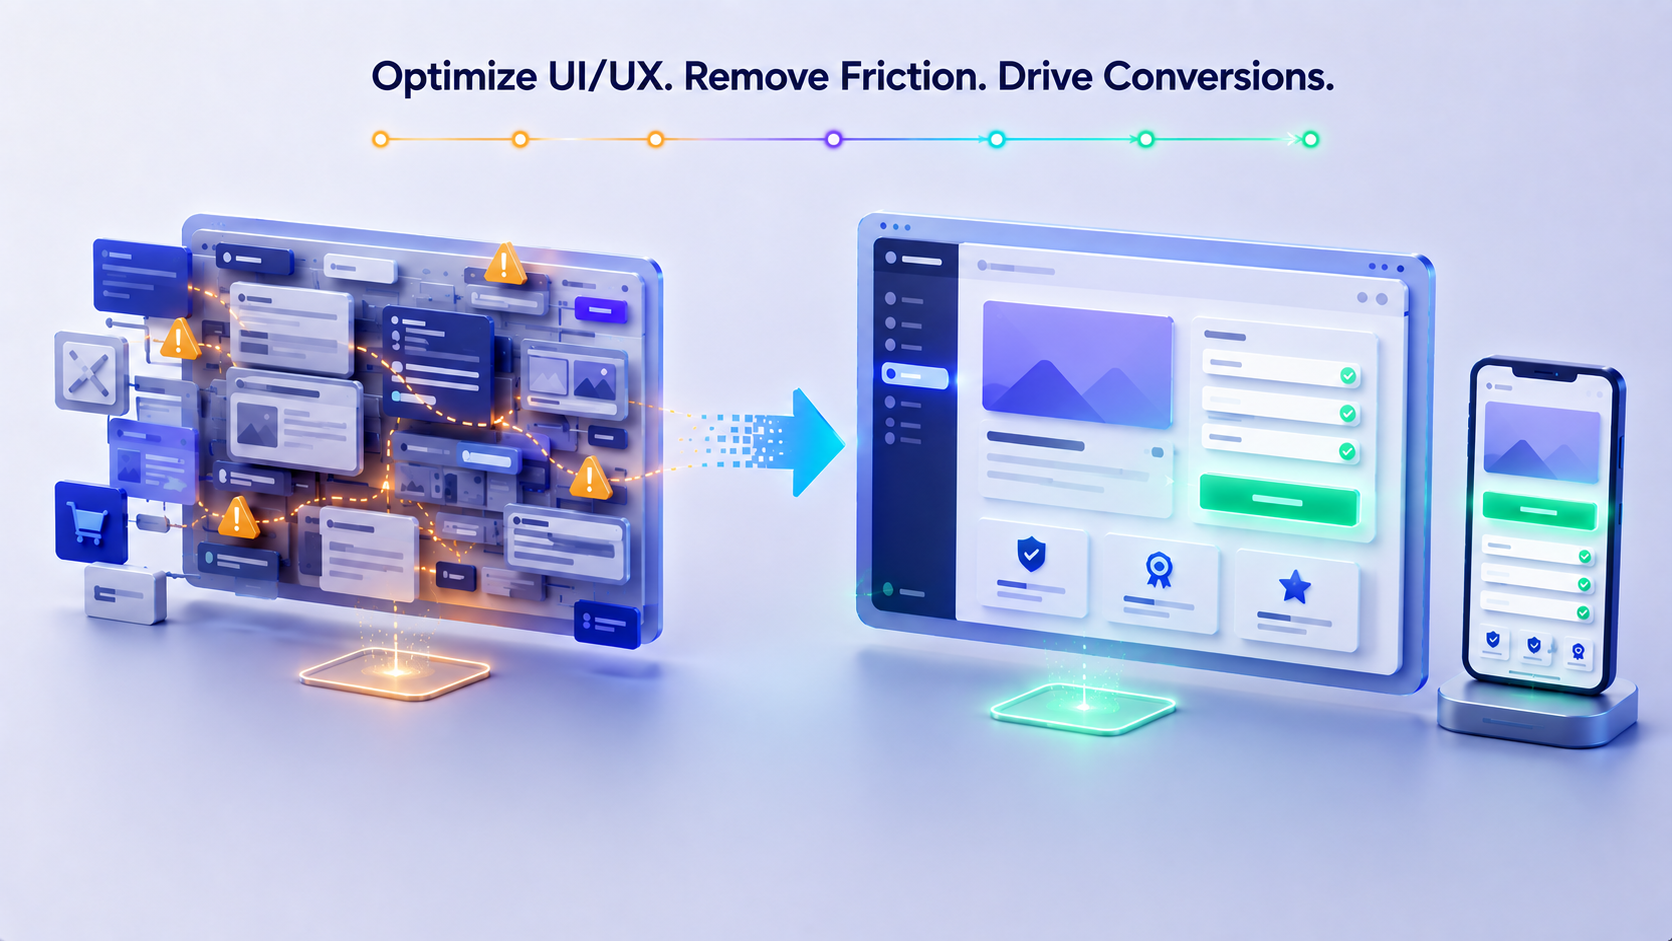
UI/UX influences how easily users can understand an offer, find the information they need, and complete a target action. Prioritize interface elements that are close to conversion or have repeatedly appeared as friction points in your research. Treat general best practices as starting points for hypotheses, then validate changes through analysis and testing.
Optimize the above-the-fold experience
On a landing page, the area visible before scrolling should quickly communicate what is being offered, why it is relevant, and what the user can do next. Prioritize a clear headline, a concise supporting message, a focused CTA, and visuals that reinforce the offer rather than compete with it.
Optimize your CTA design
A CTA should be easy to find, visually distinguishable, and clear about what happens next. Use concise, action-oriented wording, adequate contrast, and sufficient space around the control. Any claim of urgency must be genuine. Test the wording, placement, and visual treatment rather than assuming that a particular color or phrase will work for every audience.
Remove barriers to form completion
Remove fields that are not needed at that stage, use persistent labels, provide clear inline validation, and enable appropriate autocomplete. Shorter forms often reduce friction, but the goal is not to remove information required for qualification, fulfillment, or compliance. Measure both the form completion rate and the quality of the resulting leads.
Improve visual clarity
Create a clear visual hierarchy with descriptive headings, concise copy, sufficient whitespace, and deliberate use of contrast. Do not rely on color alone to communicate meaning, and ensure that text and interactive elements meet applicable accessibility requirements.
Add credible trust signals
Use genuine reviews and ratings, authorized customer logos, relevant security or payment indicators, and clear policies. Pricing, recurring charges, cancellation terms, and refund conditions should be easy to find. Avoid badges or claims that imply a certification or endorsement the business does not have.
Optimize navigation
Navigation should help users reach important pages without forcing them to guess where information is located. Use clear labels, keep the hierarchy manageable, and preserve context as users move through the conversion funnel. Analyze navigation paths and test proposed changes before restructuring menus, especially on large websites or apps.
Make your website mobile-friendly
Optimize the mobile experience with responsive design, fast loading, stable layouts, readable text, sufficiently large tap targets, and forms designed for small screens. Use appropriate input types and autocomplete where possible, and test the complete conversion path on real mobile devices rather than checking individual pages in isolation.
Conclusion
Conversion rate optimization works best as an ongoing cycle: measure behavior, identify friction, form a hypothesis, run a controlled test, and use the evidence to decide what to change next. By combining reliable analytics with qualitative research and accessible, user-centered design, businesses can improve the path to conversion without relying solely on more traffic. Not every experiment will produce a winner, but a well-designed test can still provide useful evidence for future decisions.