Data has become a key resource for modern business, and the ability to quickly extract valuable information from it is a competitive advantage. One of the most effective ways to analyze and present information is through visualization. In this article, we will consider what role it plays in making business decisions and which data visualization tools are among the top 5 most popular solutions in 2025.
What are Data Visualization Tools
Data visualization allows you to display large amounts of information in a graphical format, clearly presenting the trends, patterns, and statistics they contain. For this, various visual elements are used: graphs, maps, heat maps, pie charts, histograms, Gantt charts, infographics, and much more.
Visualization makes data understandable to a broad audience. It helps data scientists find and generate ideas, organize information, and illustrate the insights they uncover.
Data visualization provides businesses with the following benefits:
- Increased accessibility of information. Visualization helps simplify large and complex datasets by turning them into visual graphs, charts, and infographics. This makes information easier to perceive and understand for different categories of users, from analysts and management to external stakeholders and end customers.
- Increased engagement and retention of audience attention. Data presented in a visual format is much better at attracting attention and retaining interest. Effective visualization transforms scattered raw data into engaging and persuasive narratives. This is especially important when creating presentations, reports, and marketing materials.
- Improved analytics and decision-making. Graphic elements allow you to quickly detect trends, anomalies, and relationships that might otherwise go unnoticed when analyzing raw numbers. This enables professionals to make timely decisions, saving time and other resources.
- Support for real-time monitoring. Data visualization tools are widely used in analytical dashboards, allowing companies to track key business indicators in real time. With them, companies can get the necessary information faster and use it to solve problems in the areas of sales, marketing, operations management, supply chains, and more.
Data visualization tools have become an integral part of analytical processes in business, education, science, and other areas. Currently, solutions that combine broad functionality, integration with other systems, and a user-friendly interface are in demand. Let's explore the five popular data visualization tools that are actively used today in companies of different sizes and industry specifics.
Tableau
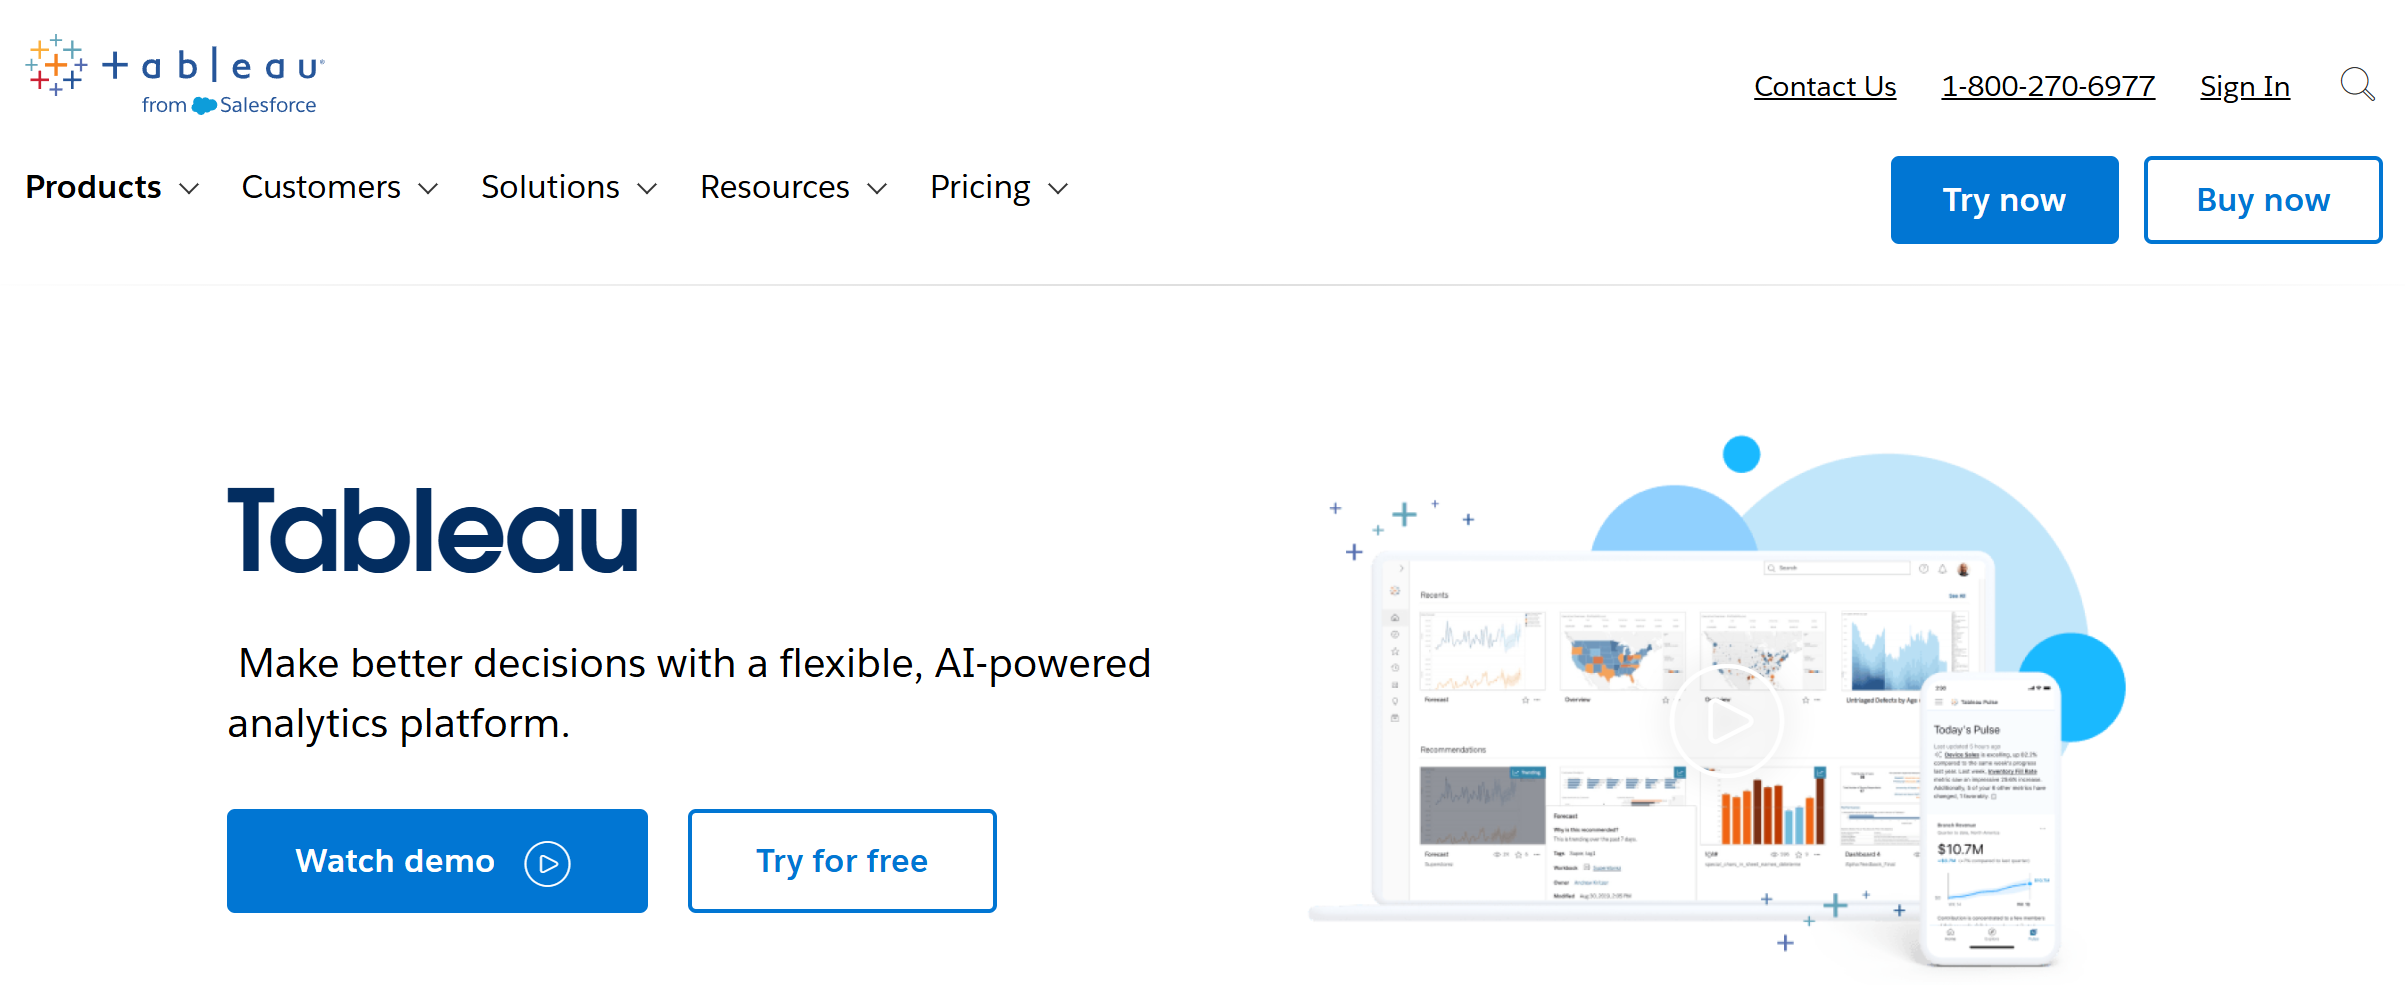
Developed by Tableau Software (now owned by Salesforce), the Tableau platform is one of the most well-known big data visualization tools, widely used in corporate analytics. It provides a solid set of features for data management, visual storytelling, collaboration, and process automation, thanks to the built-in Einstein Discovery AI module. Tableau is actively used in a variety of areas – from finance and retail to healthcare and the public sector.
Key features:
- Users can flexibly visualize their data in a variety of graphical formats: graphs, charts (pie, line, histogram, etc.), maps, treemaps, tables, and more.
- In addition to standard formats, Tableau supports a number of charts and graphs with advanced options. Gantt charts, box plots, and bullet charts help visualize complex, large datasets.
- Visualization features allow you to visualize disparate information and organize it into coherent storytelling using different types of graphics, colors, and patterns.
- The platform has a number of functions for data processing and analysis. These include scaling, operationalization, cataloging, and combining information from multiple sources with subsequent comparison of datasets.
- The service's arsenal includes advanced AI data visualization tools. The Tableau GPT virtual assistant automates data operations, including data preparation, compiling calculations, and source descriptions through dialog prompts.
Tableau provides three subscription options tailored for individuals and small businesses:
- Viewer – $15 per user per month.
- Explorer – $42 per user per month.
- Creator – $75 per user per month.
A separate tier is available for enterprises:
- Enterprise Viewer – $35 per user per month.
- Enterprise Explorer – $70 per user per month.
- Enterprise Creator – $115 per user per month.
You must pay for the entire year of your chosen subscription at once. A 14-day free trial period is provided to test the service before purchasing. Educators and students are eligible for complimentary access to Tableau Desktop, Tableau Prep, and educational resources for one year.
Looker Studio
Looker Studio (formerly Google Data Studio) is one of the best examples of data visualization tools. It helps individual and corporate users easily transform large data sets into informative reports and dashboards with a variety of graphics. In addition, the platform offers extensive opportunities for connecting external sources and collaborating.
Key features:
- The simple, intuitive interface allows you to work with the online service without prior training. Users have access to a drag-and-drop editor for creating reports, customizable property panels, and a grid-based canvas for precise alignment of elements.
- Looker supports over 30 types and options of visualizations: progress charts, scatter charts, pie and donut charts, timelines and funnels, and different types of tables and maps.
- A large library of report templates helps you quickly visualize data, connect different sources, and customize the design to suit your needs.
- The platform is capable of ingesting data from over 800 different sources through pre-installed connectors that enable fast transfer and unlimited data use.
- Looker's integration with BigQuery allows you to launch your own data warehouse or lake with extensive capabilities for storing, analyzing, and visualizing data.
- Enterprise users of Google Workspace and Cloud Identity can streamline data management and migration between platforms using the Looker Studio API.
Looker Studio belongs to the category of free data visualization tools, as it offers its basic functionality to everyone at no cost. To access enterprise-level system administration and business analytics, you must purchase a Looker Studio Pro subscription. It costs $9 per user or project per month.
Microsoft Power BI
Microsoft Power BI is a powerful and flexible service that holds a leading position among business intelligence data visualization tools. It allows creating interactive reports and dashboards, combining data from multiple sources and providing a deep analytical overview. Integrations with other Microsoft products and extensive customization options make Power BI an indispensable assistant for both large companies and small businesses.
Key features:
- The platform supports various visual formats: for comparison (histograms, line and area graphs), correlation (scatter charts), distribution (grouped bar charts, bubble charts), ranking (ribbon charts, funnels), and others.
- With the built-in SDK, users can fine-tune visualizations using JavaScript libraries such as D3 and jQuery, including Gantt charts, line gauges, radar charts, filter slices, and other charts.
- In addition to visualizations, Power BI helps you develop flexible reports and dashboards of several types. Moreover, the platform provides tools for consolidating, structuring, and deeply analyzing large amounts of data.
- The service supports the import and visualization of data from multiple sources, including Excel, CSV, JSON, PDF, and XML files. It can also process data from MySQL and PostgreSQL databases, SAP Business Warehouse, Snowflake, Google BigQuery, Redshift, as well as Microsoft Power Platform and Azure platforms.
- Users have access to over 300 connectors for integration with third-party systems. If necessary, it is possible to connect custom connectors via API.
For those looking for the best free data visualization tools, Power BI is worth checking out. It offers a free subscription. To use it, you just need to register for a Microsoft Fabric account. There is no need to pay for it either.
In addition, the platform offers 3 paid tariff plans:
- Pro – $14 per month per user.
- Premium – $24 per month per user.
- Embedded – the cost is calculated individually and is provided upon request.
You must pay for the subscription to the selected tariff plan for the entire year at once. There is no monthly payment option.
Google Charts
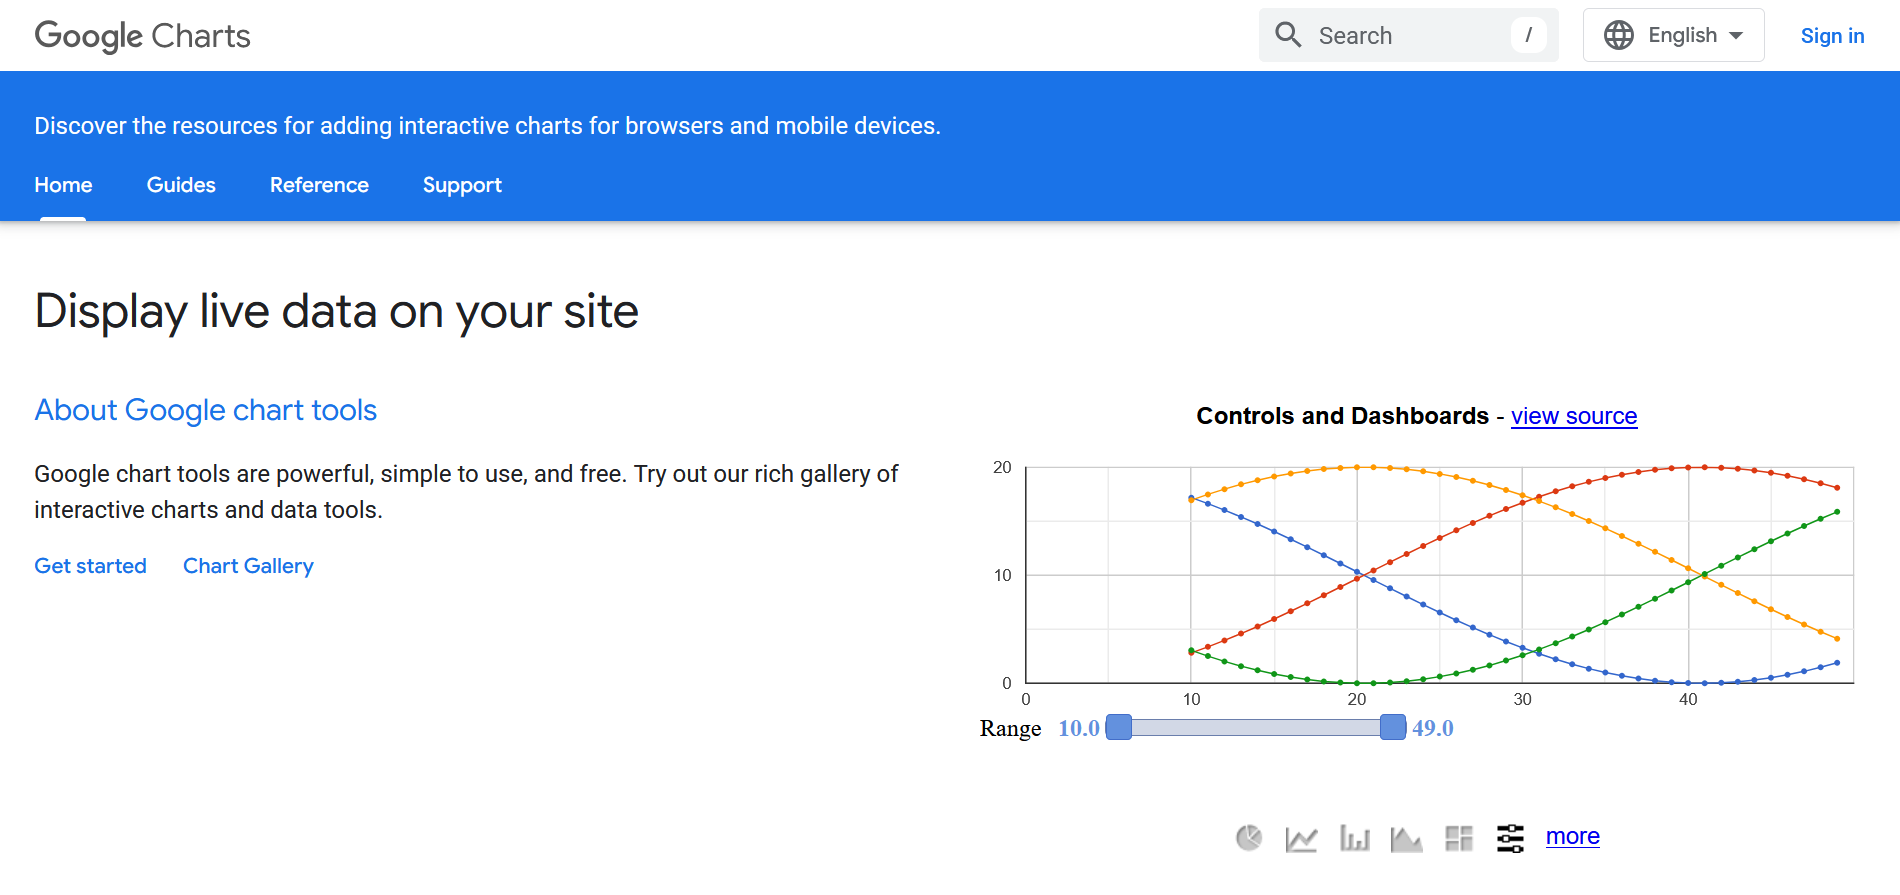
Google Charts is often seen in the lists of popular data visualization tools. It is highly valued for its simplicity and ease of use. The service supports HTML5 and SVG. This ensures high-quality and stable charts in modern browsers like Chrome, Firefox, Safari, and Internet Explorer on devices from PCs to smartphones and tablets. It allows you to quickly create interactive charts that fit perfectly into web applications.
Key features:
- The service supports a number of visual formats: line and dynamic graphs, heat maps, timelines, different types of diagrams (pie, scatter, bubble, area, area diagrams, 3D diagrams), and more.
- The tool provides dynamic loading of data from external servers and also allows you to control them through callback functions.
- Users can flexibly customize charts and graphs using JSON to describe different configurations. Charts can be modified not only during the creation process but also afterward.
- The portable loader and the main library have a minimal size. This significantly simplifies the use of the service on any device.
- When you hover over any point of a graph or chart, tooltips are displayed. Special functions and built-in formatting tools are available for customizing them.
Google Charts is open source and free for non-commercial use.
Sisense
Our review of top data visualization tools is completed by the Sisense platform. This is a cloud-based AI solution with broad functionality for monitoring, collecting, analyzing, and visualizing data. Its capabilities allow you to create visual dashboards and automate the processing of large volumes of information. The service scales well and is suitable for both small teams and large corporations.
Key features:
- The Perspectives engine allows you to create submodels, providing customized views of data. Such submodels can be tailored to specific projects, tasks, and user roles, changing the structure, calculations, and visualizations.
- The platform collects and processes data of various formats and volumes, thanks to support for over 400 built-in and third-party connectors. In addition, it provides seamless integration with on-premises data sources and storage.
- The AI assistant enables users to automate visualization development processes using text prompts. Moreover, it allows you to receive instant answers to questions of interest and explanations in the form of diagrams.
- GenAI Narration generates detailed explanations of what any chart or dataset shows. Natural Language Generation (NLG) technology provides “analytical storytelling,” offering detailed insights into your data.
- The platform tracks and analyzes data in real time, instantly sending notifications about changes or anomalies found in it. This helps businesses quickly monitor KPIs and make important decisions based on the information received.
Sisense offers customers personalized feature packages that match their needs, budget, and use case. The cost of services is calculated individually and can be determined by sending a request to the sales department.
Final Thoughts
The best data visualization tools today help companies quickly and efficiently transform large and diverse data into visual graphs and charts. This makes it easier to find key insights and improves the quality of business decisions.
The choice of the right service depends on the specific tasks and the level of training of users. For example, Looker Studio is a great choice for those who value convenience and free access, needing only basic functions. If your company requires deeper analysis and flexible customization of visualizations, Microsoft Power BI will offer rich functionality and many integrations with various data sources. For large organizations with significant volumes of information and the need for automated analytics, Sisense with AI and scalability is a better choice. If working with advanced visual storytelling is important, you should pay attention to Tableau.
Having studied the capabilities of tools for data visualization presented in our article, you will be able to better understand the functionality of each service. This will help you choose a solution that will most effectively solve your business problems, considering the budget and technical requirements.
Also read on our blog:
- Google Lead Form and Smartsheet Integration: Automatic Addition of Rows
- Perplexity AI: The AI-Powered Search Engine Revolutionizing Information Access
- Cursor AI Unleashed: The Agent-Powered Code Editor Transforming Developer Workflow
- Mastering Cohere: A Guide to Advanced AI Language Models
- How to Integrate TikTok and Notion: Step-by-Step Guide
