Are you certain that the advertising campaign you launched on Facebook is really working successfully? To make sure of this, you need to know what indicators to track. This article will help you figure it out, understand how to set up performance metrics in Facebook Ads Manager, and evaluate campaign results.
What metrics are important to track
In the process of creating and setting up a Facebook advertising campaign, the users select key performance indicators (KPIs) that will allow them to evaluate the effectiveness of ads after launch. Ads Manager offers over 350 such criteria. Of course, tracking each of them is physically unrealistic. To assess the quality, success and effectiveness of advertising on the social network Facebook, 8 main parameters will be enough for you:
- conversion cost;
- price per click;
- cost per 1000 impressions;
- click-through rate (CTR);
- advertising relevance analysis;
- ad engagement;
- viewing frequency;
- return on advertising spend.
We invite you to familiarize yourself with each of them.
Cost Per Conversion
This parameter shows how much each conversion action costs. We are talking, for example, about clicking on a link, filling out a form by a potential client, placing an order. Estimating the cost of such audience actions will help you better control the budget, preventing overruns or underspending.
Tracking this parameter, you get the following information:
- fluctuations in the price of the conversion action;
- spending on each individual conversion;
- advertising with the highest conversion;
- ads with a minimum level of effectiveness;
- campaigns that better than others "hooked" the target audience.
Cost Per Click (CPC)
CPC provides information about the cost of 1 click that was made on your Facebook ad. It is important to carefully monitor this parameter to evaluate the effectiveness of the campaign you have launched. Reducing the cost of a click indicates that advertising and its targeting settings are effective in attracting the attention of users and encouraging them to click on the link. In addition, the analysis of the CPC indicator helps to control and optimize the advertising budget. For example, campaigns with a minimum CPC can be extended, and those with a maximum CPC can be stopped early.
Cost per 1000 impressions (Cost Per Mille - CPM)
With CPM, you can find out how much 1,000 impressions of your ad on a business page or website cost. This parameter allows you to determine the financial success of the campaign and make comparative analytics on the costs of different campaigns, as well as on advertisers.
It is important to follow the CPM to understand how the price changes for a particular placement and what influences it. This metric will help you see if your ad placement cost is going up, compare your costs across multiple platforms, and figure out where to advertise in the future.
Click-Through Rate (CTR)
This indicator does not consider all clicks in a row, but only those that lead to a business page. If a user clicks on a link posted in a Facebook post and is then redirected to the Home Page, that's just a click on the link. But when users click on the link that is in the Facebook ad, after which they go to the advertiser's business resource, this already goes into the CTR.
CTR can be called the KPI of Facebook advertising. It shows the number (in percentage terms) of users who clicked on the ad while viewing it. Tracking CTR is essential to make sure that users get really high-quality content, they understand and like sponsored posts.
Ad relevance analysis
Comparison with competitors is one of the important tasks in any business. To periodically perform it, Facebook offers to use the built-in ad relevance level diagnostics. After receiving the results, you can decide who is more profitable to show your ads and how much they should cost.
There are 3 rating parameters available for diagnostics:
- involvement;
- quality;
- conversion rate.
It is recommended to monitor all three parameters.
Ad engagement
This parameter shows how many interactions (reactions of various types, comments, shares and clicks) your ad received. If you're A/B testing multiple types or formats of ads at once, ad engagement and CTR are two of the most important metrics you can use to figure out how attractive a given ad was to your target audience.
View frequency
This metric is the average number of times a person views your ad. If your target audience is narrow enough, frequency is a particularly important criterion.
People, as a rule, need to review ads 3-4 times before making a conversion. But if they've already seen it over 10 times, it's probably too much. In this case, it is advisable for you to expand your reach. If, however, the conversion rate remains at a high level, you, most likely, have not had time to bother your “marketers” yet.
Return On Ad Spend (ROAS)
ROAS is one of the most important metrics used to analyze the effectiveness of Facebook ads. Controlling this parameter will let you know how much you've earned compared to your campaign costs. The greater the profit for every dollar you spend, the greater the efficiency.
Remember that you can control ROAS only if you install Facebook Pixel in advance. This is an analytical tool (code snippet) that should be placed on your business page or website.
How to set up ad performance metrics in Ads Manager
In your Ads Manager account, you'll see all the campaigns you've ever launched. First, select the one with which you will work. To set up the metrics that Facebook will calculate, go to the "Columns" menu. You will see a list with many reports already configured for different indicators.
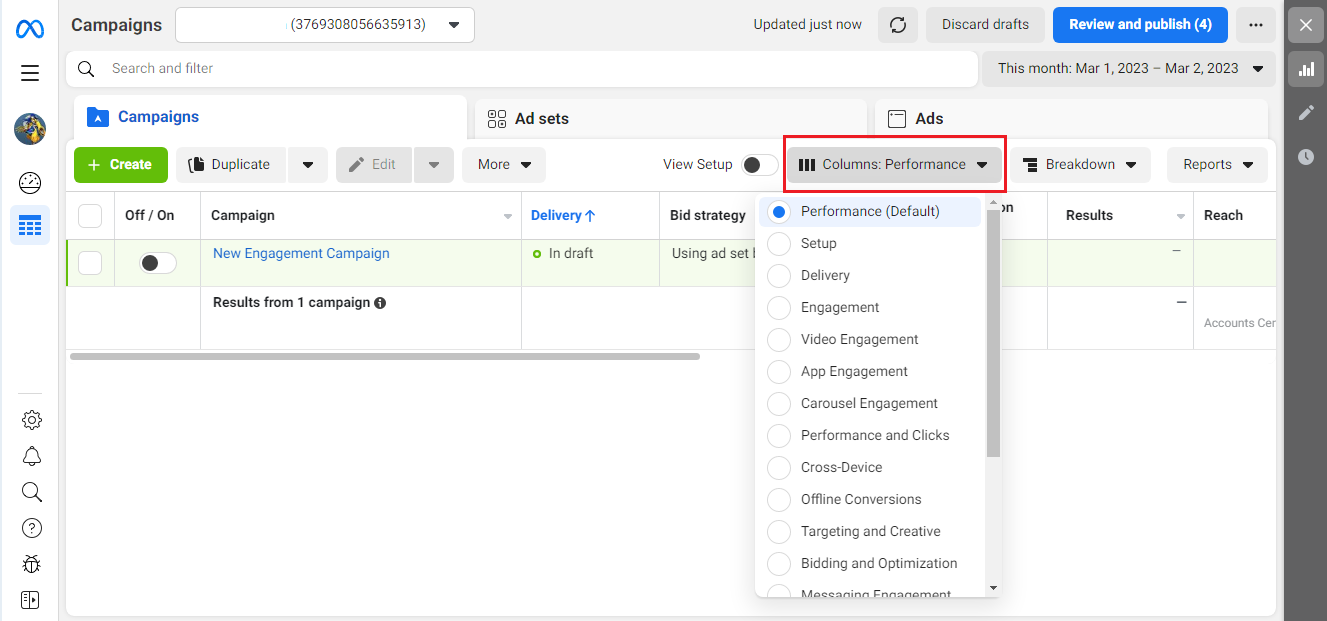
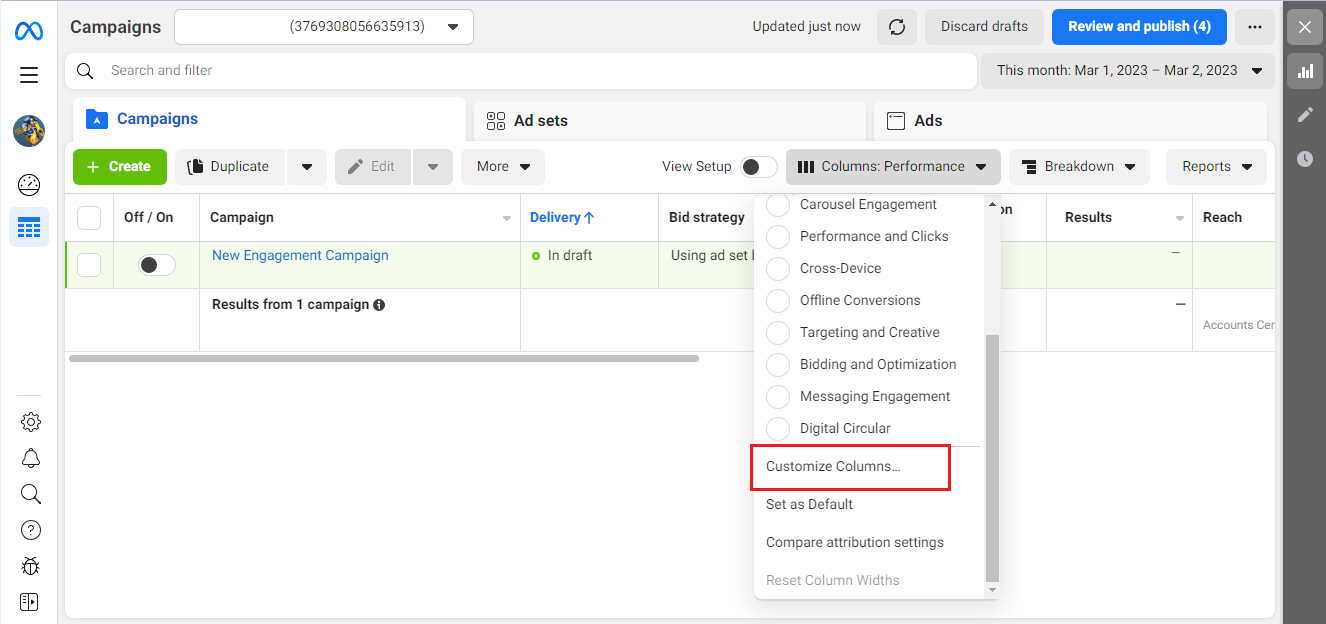
It is much more convenient to use not blanks, but your own report, which will contain only those indicators that you need. To create it, select "Customize Columns" from the "Columns" dropdown.
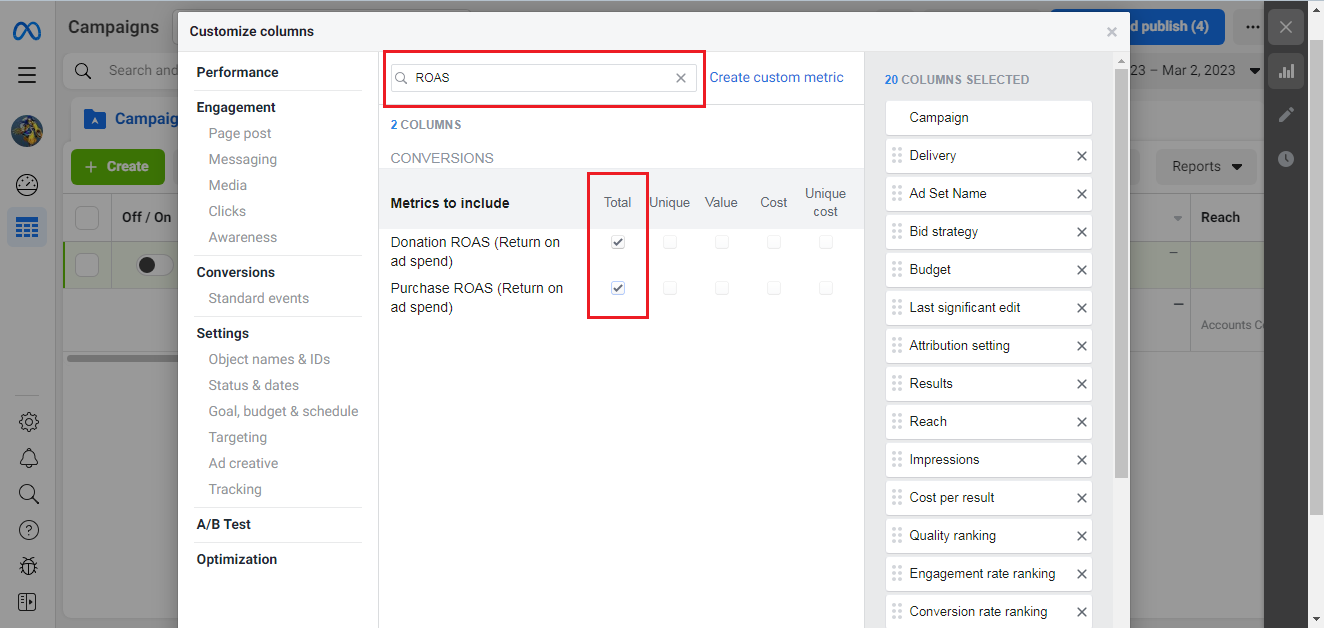
To add the indicators that we discussed about above, write the abbreviation "ROAS" in the search line. Put a checkmark on the item "Total". Facebook will add the selected option to the column on the right.
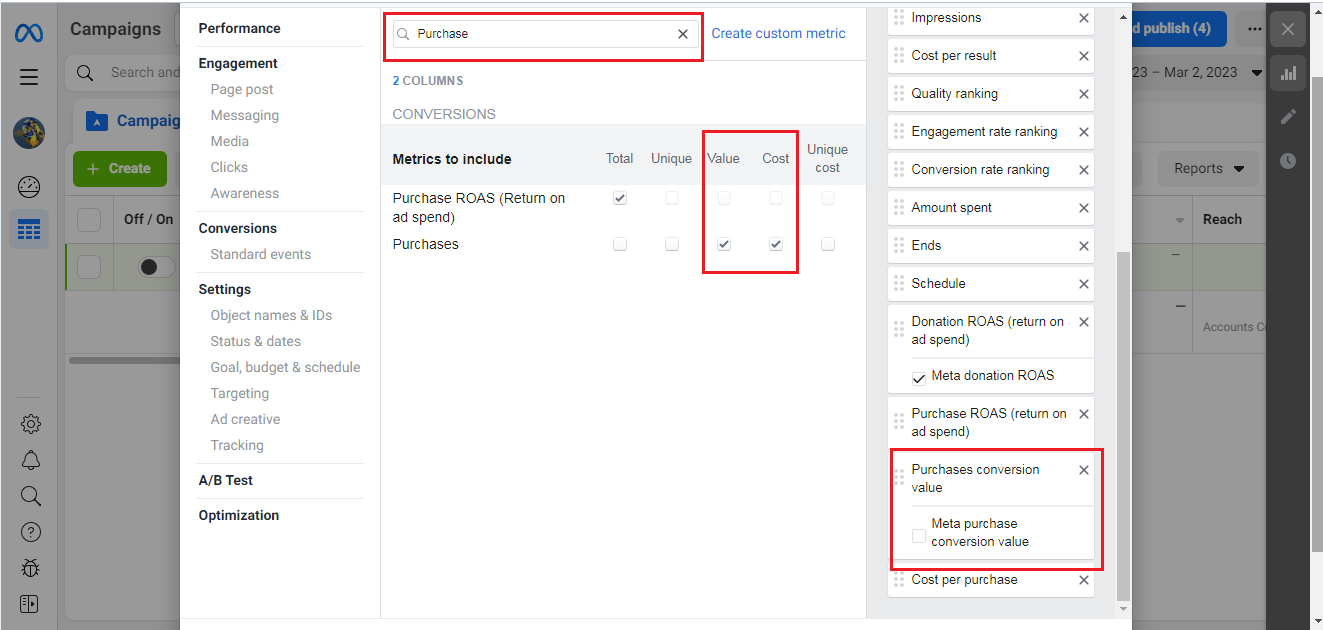
Now let's move on to adding other parameters – cost per purchase and purchase conversion values. To achieve this, write the word "Purchases" in the search bar. Check the boxes "Value" and "Cost". After that, the indicators you selected will appear in the right column. Pay attention to “Purchases conversion value” in it – be sure to remove all marks from this section.
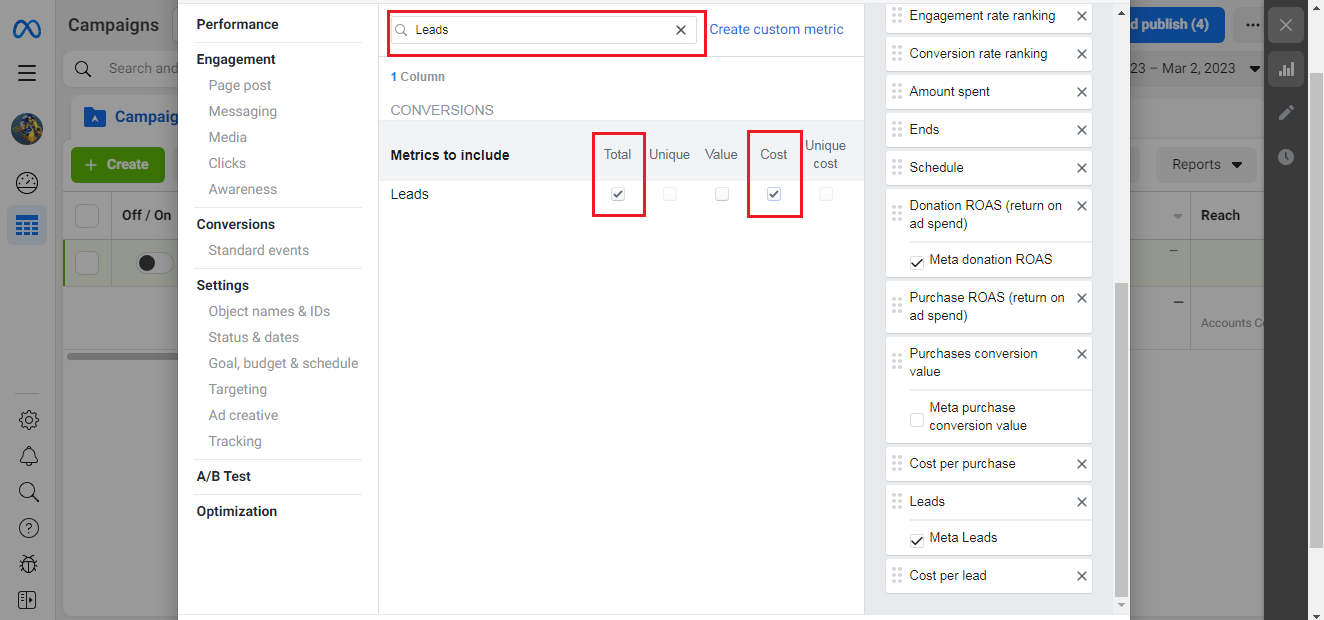
The next step is EPL. This indicator is not available in Ads Manager, so you will have to calculate it manually. To complete this, you need to know the number of leads. To achieve this, add the desired parameter by entering the word "Leads" in the search box. Check "Total". You can immediately put it on “Cost” to add another criterion to yourself – CPL.
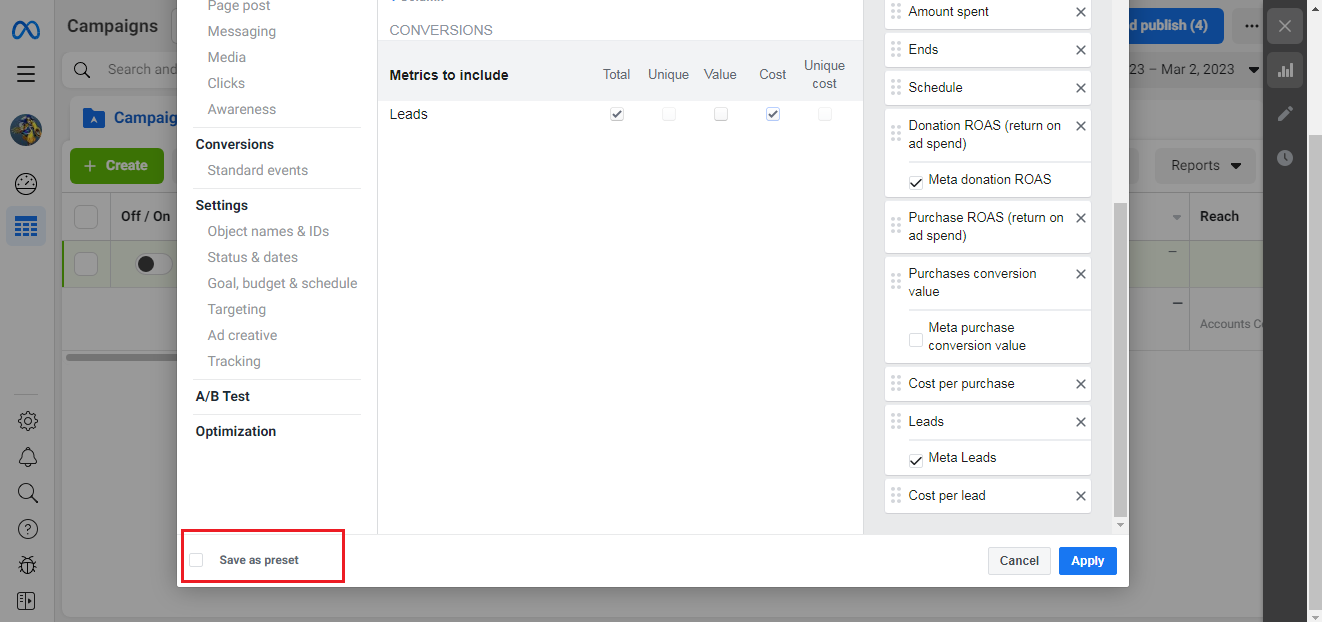
In the same way, add all the necessary indicators one by one. Don't forget to save your report at the end. To complete this, click on "Save as preset" (located at the bottom left).
Now you will be able to see all the parameters you added to track the effectiveness of your advertising campaign. When you run it, they will be calculated automatically.
How to evaluate results
Some of those who launch an advertising campaign for the first time rush to see its results the very next day after launch. It's interesting what's there. Doing this is not recommended. The system needs at least 3 days to select an audience for your campaign that is highly likely to do what you need – like an ad, click on links, repost, subscribe, comment. Therefore, it is best to analyze the first results and evaluate them not earlier than a week after the launch day.
When evaluating the level of advertising effectiveness, it is important to look not only at the current indicators, but also over the past 7 days, month, quarter, and even the whole year. This way you can find out how they fluctuate and take stock of which adjustments were successful and which were not.
Evaluation of the effectiveness of an advertising campaign should be carried out not only to understand its impact, but also to increase profits. Use the received data to reduce the cost of a click and a lead, increase the flow of completed requests, and turn a losing campaign into a profit. Build new strategies to improve efficiency, test them and keep real working schemes.
You probably know that the speed of leads processing directly affects the conversion and customer loyalty. Do you want to receive real-time information about new orders from Facebook and Instagram in order to respond to them as quickly as possible? Use the SaveMyLeads online connector. Link your Facebook advertising account to the messenger so that employees receive notifications about new leads. Create an integration with the SMS service so that a welcome message is sent to each new customer. Adding leads to a CRM system, contacts to mailing lists, tasks to project management programs – all this and much more can be automated using SaveMyLeads. Set up integrations, get rid of routine operations and focus on the really important tasks.
