Infographics are one of the most sought-after areas of design. This method of presenting information is actively used in advertising and marketing. It helps to succinctly and clearly visualize various data sets, adapting them for placement on the Internet, printing, outdoor advertising, and other formats. Until quite recently, only professional designers with considerable experience could create high-quality infographics. Now its development is available to literally everyone, thanks to the distribution of special services – infographic makers. We invite you to familiarize yourself with our next selection of useful software, consisting of the 7 best programs for working with this direction of design, as well as explore the key features and capabilities of each of them.
Today, infographics are especially common in the field of Internet marketing, as they help to clearly and intelligibly visualize any data. This is a painstaking job that requires time and some preparation. Fortunately, now any user can save many resources by using convenient and functional services – infographic designers. With their help, you will be able to visualize data colorfully and concisely in a matter of minutes by selecting the appropriate template from the catalog and finalizing it using an extensive set of built-in tools.
So, we suggest you consider the 7 most popular services for developing infographics in 2023.
Canva
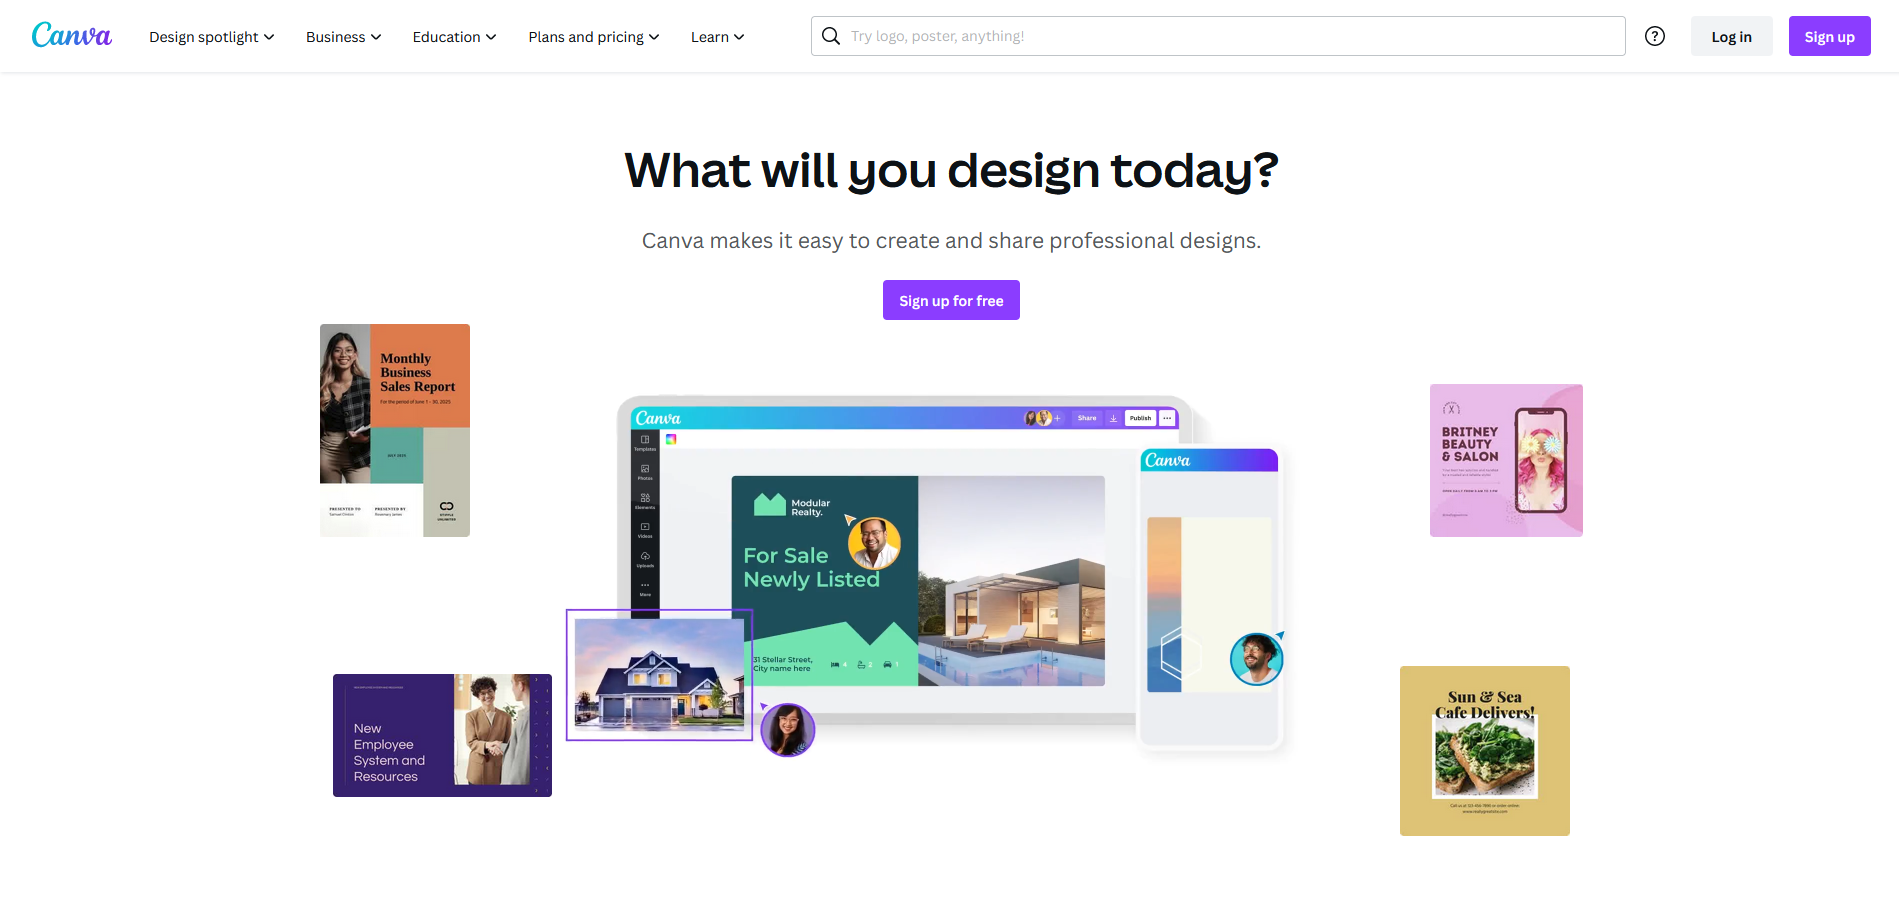
In first place in our selection of the best infographic makers is the popular graphic editor Canva. This versatile tool is optimal for individual users and small businesses. It is also suitable for all those who want to create professional, modern infographics with minimal effort and cost. Most often, this platform is used to develop content for Facebook, Instagram, and other social networks.
Key features:
- Canva has an impressive catalog of graphic elements, from simple icons to colorful illustrations and animated stickers. Among them, there are those in which you can change the color palette, while others lack the possibility of customization. In addition, the service has a wide range of frames, shapes, graphs, charts, mind maps, and other details for the colorful design of infographics.
- A solid library of thematic templates, divided into categories (for example, “business”, “services”, “education”, and so on), allows you to choose the most accurate template for your future infographics. Over 250,000 templates are absolutely free. Some of them can be flexibly customized by replacing their icons or images with paid or owned content. There are separate layouts for infographics in video format.
- Free data visualization tools online on this platform allow you to flexibly edit infographics through an intuitive and functional drag-and-drop editor with a web interface.
- Built-in collaboration tools make it possible to efficiently create and modify infographics not only individually but also in group mode.
Canva offers a complete free plan with basic features. The paid individual plan for Canva Pro provides you with access to a library of 2 million images as well as additional fonts, animations, backgrounds, and tools. It costs $12.99 per month. Canva Teams for $14.99 a month gives you all the benefits of the Pro plan plus more teamwork.
Venngage
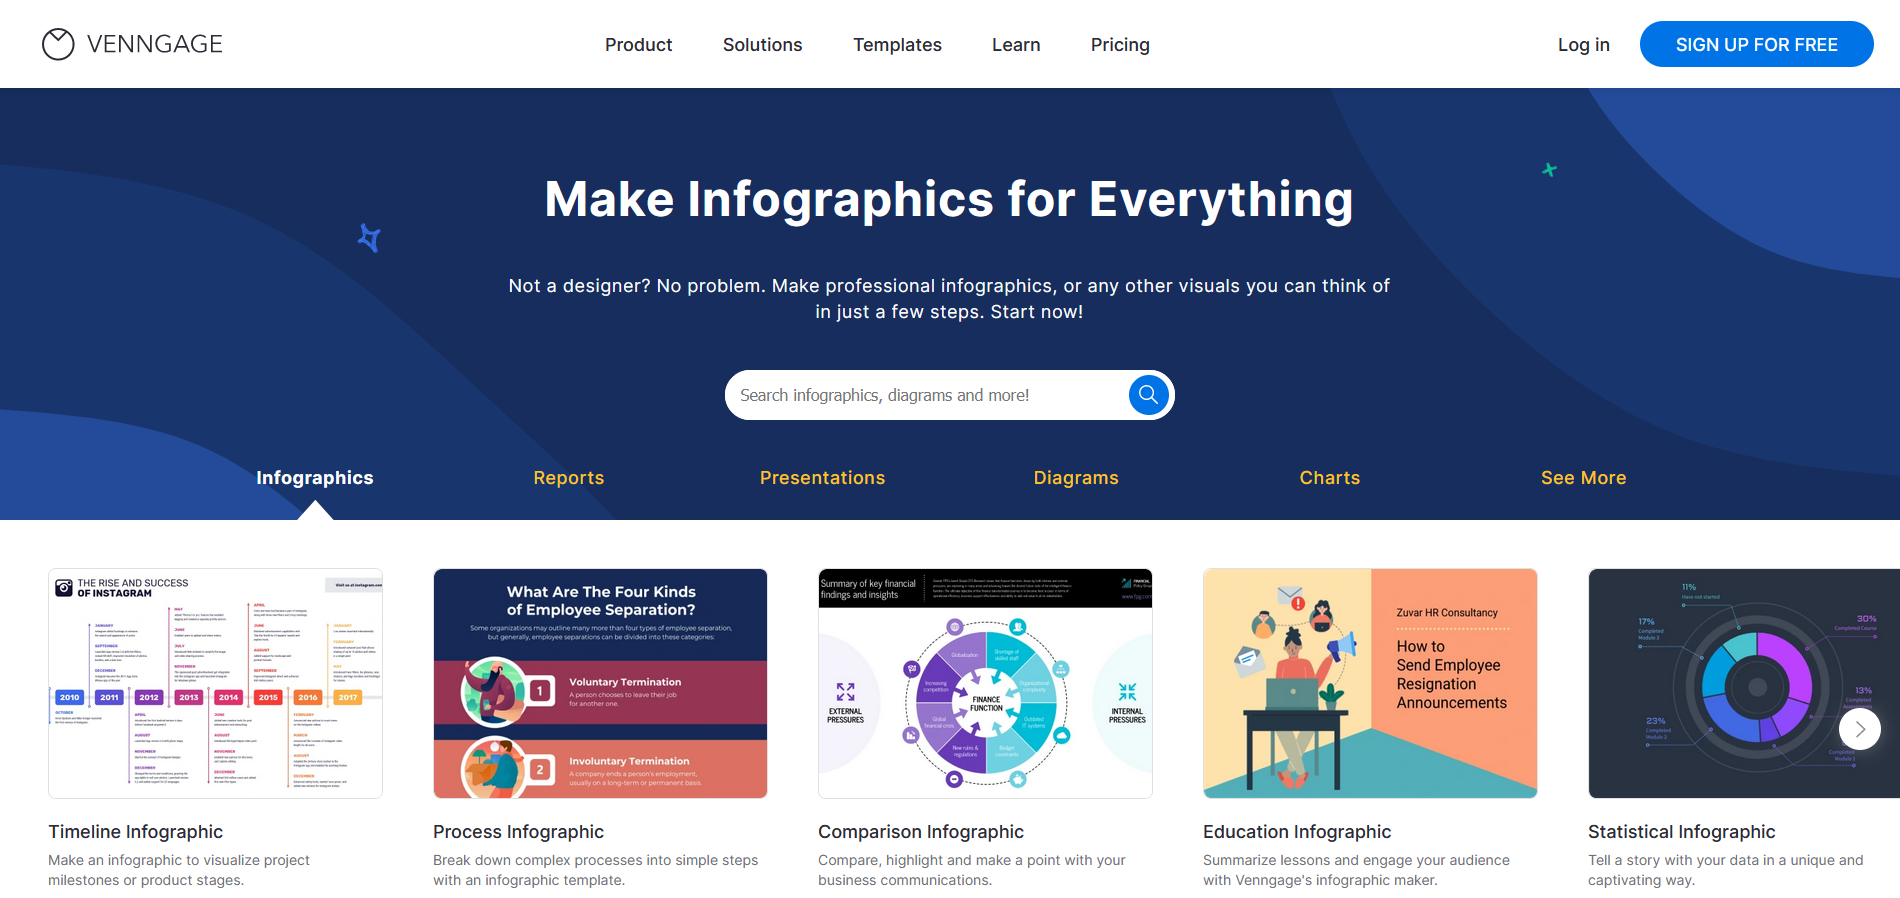
Next on the best tools for infographics is Venngage. It is in demand among marketers who are looking for a clear and functional online infographic editor that does not require special knowledge or skills. Unlike many other similar programs, Venngage is highly specialized, but it can also create charts and reports.
Key features:
- The platform offers 7500+ infographic templates (statistical, informational, processes, comparisons, timelines, geographies, charts, tutorials, etc.), including infographic templates in video format.
- An extensive library of 40,000+ illustrations, icons, and graphs with a search function allows you to flexibly customize templates. A catalog of gradients and background patterns is available. It is also possible to upload external images and fonts.
- Venngage allows you to customize infographics with a widget system that includes maps, graphs, and other data visualizations.
- The Brand Kit feature helps you brand infographics manually or automatically (available on the Business plan) using branded colors, fonts, and logos.
Having a free version with five templates available makes Venngage one of the most popular free infographic makers. The most budget-friendly Premium plan, which provides an unlimited number of templates and the import of up to 50 images, will cost $19 per month. The Business plan with the ability to import up to 500 images and additional business templates costs $49 per month. The Enterprise tariff for large companies is offered on individual terms.
Adobe Creative Cloud Express
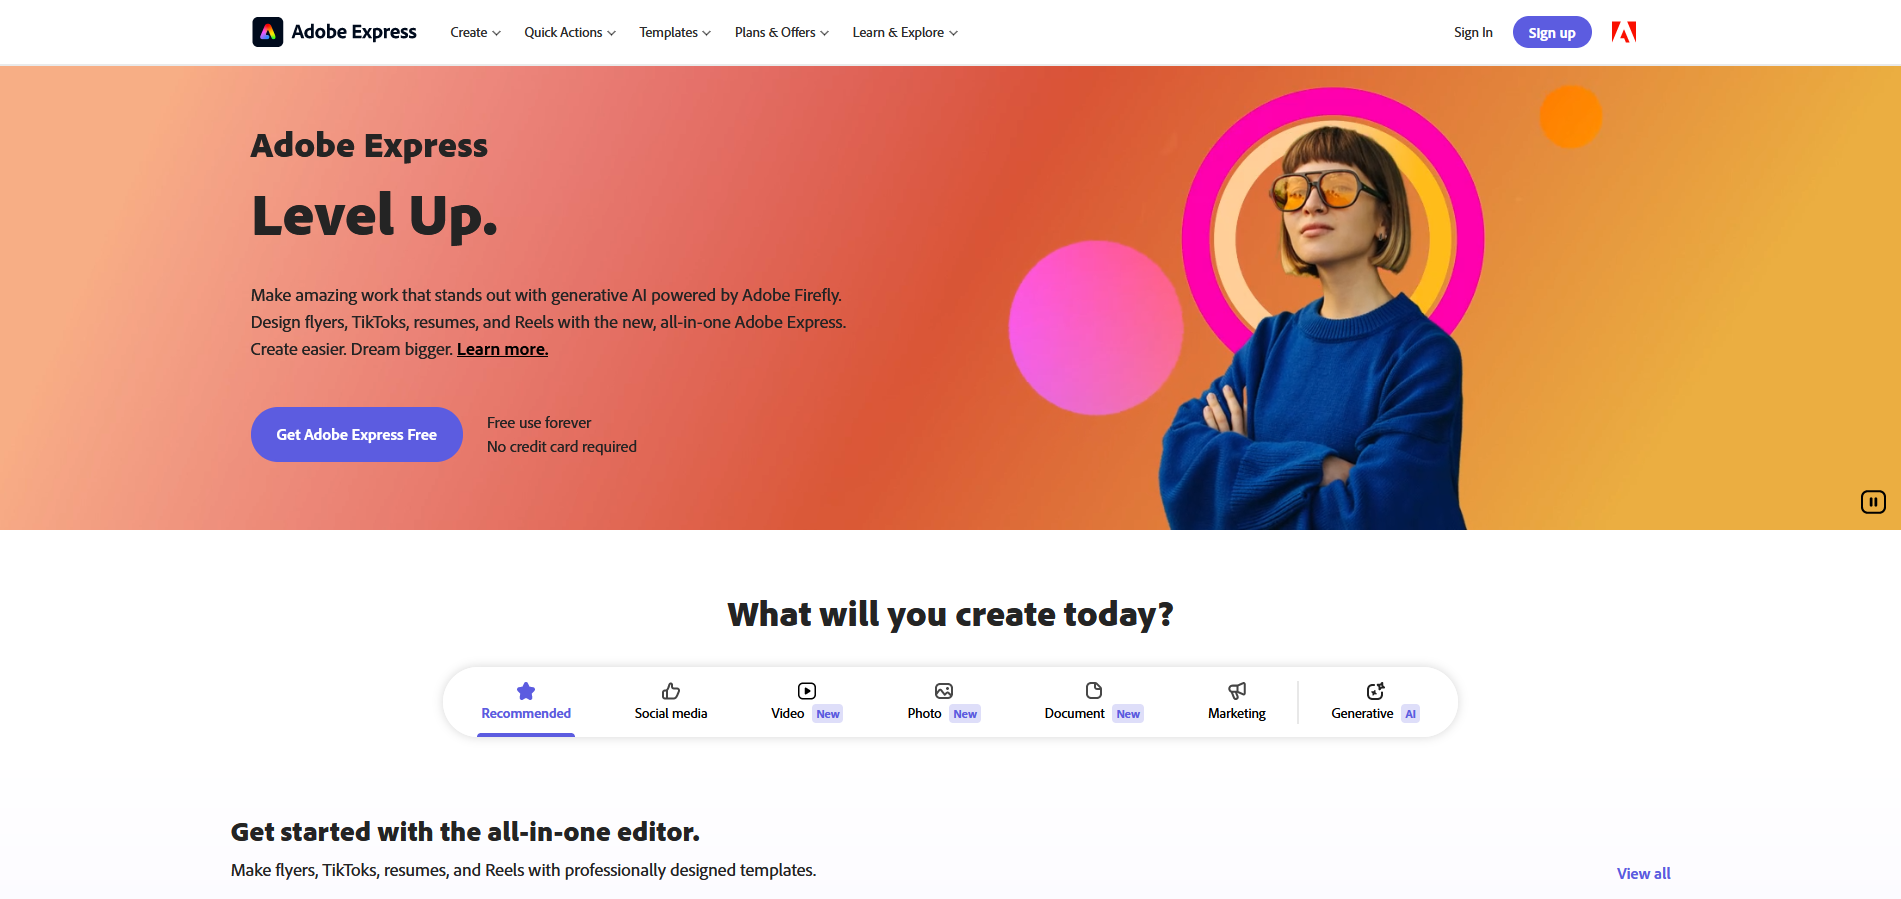
Adobe Express (formerly Adobe Spark) is professional infographic software for businesses. With it, users can quickly and efficiently design infographics on desktop or mobile devices. The service also allows you to create short videos (shorts) and even entire web pages.
Key features:
- Over 10,000 free and paid templates and thousands of license-free graphic elements (images, icons, fonts, layouts, backgrounds, and colors) allow for flexible customization of infographics.
- There is a web interface and a mobile application for iOS and Android. The finished design is easy to import in different formats or send by email.
- Block's drag-and-drop editor allows you to create and modify infographics without any skills or tools. Users can add backgrounds, change text, upload images or icons from external sources, and so on.
- Infographic branding feature: any template can be easily customized by uploading a company logo, corporate colors, and fonts.
- Built-in collaboration tools allow the infographic creator to invite other users to edit it in team mode.
- The finished design automatically adjusts to the formats of various social networks.
Adobe Express refers to free tools to create infographics. In addition to the basic free version, there is an individual Premium plan with advanced features (full access to templates) for $9.99 per month. The Team Adobe Express Enterprise Plan costs $19.99 per month.
Snappa
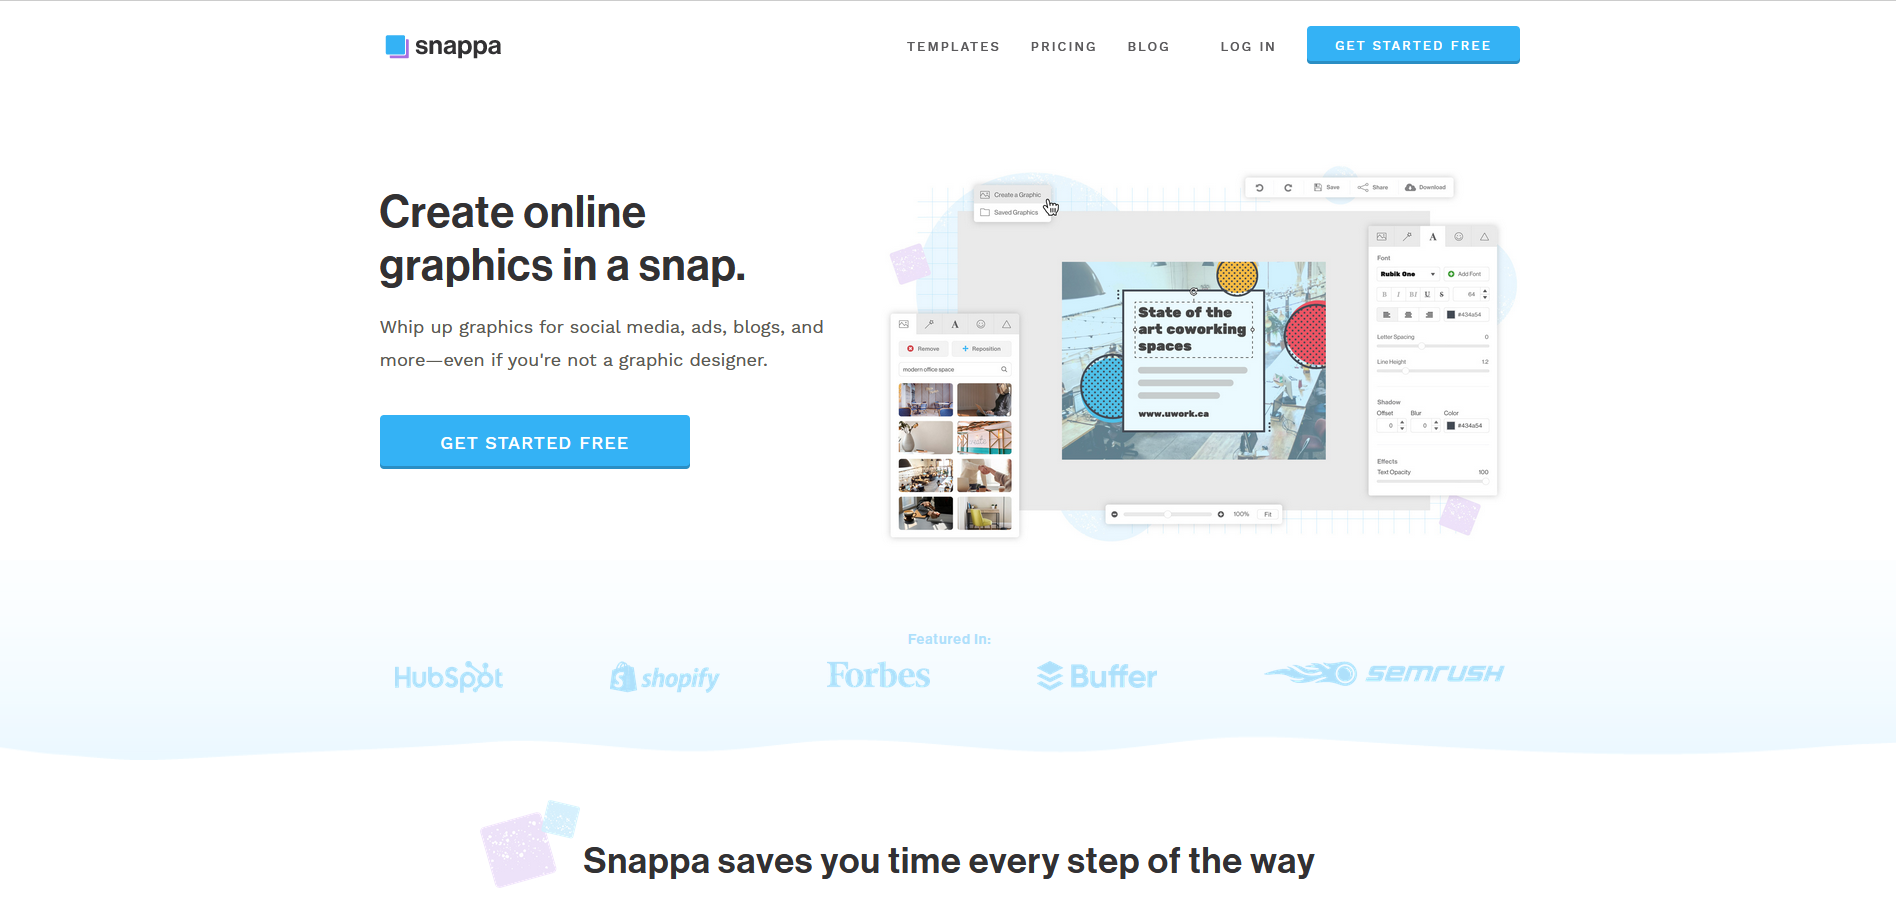
Snappa, a simple, user-friendly, and versatile web-based editor, takes its rightful place in our collection of the best online visualization tools. While this service is primarily designed for social media graphics, it is also great for infographics.
- Automate the work with leads from the Facebook advertising account
- Empower with integrations and instant transfer of leads
- Don't spend money on developers or integrators
- Save time by automating routine tasks
Key features:
- 6,000+ pre-installed design templates and over 5,000,000 high-quality stock images and graphics in the catalog.
- The templates are organized into thematic categories: posts for Facebook, Instagram, Twitter, LinkedIn, Pinterest; images and covers for blogs; banners for LinkedIn, Twitch, SoundCloud, YouTube, and so on.
- A built-in tool for cropping images according to specified sizes for various purposes: publishing posts on social networks, pictures in articles and news, banners on websites, letters, and more.
- Basic special effects offer one-click background removal as well as a number of text and graphic elements, including vector ones. The size of these design elements can be easily and quickly changed to create a suitable composition.
- Integration with Buffer provides simplified and accelerated integration with social networks. For example, it allows you to publish infographics to Pinterest directly from the service.
Snappa rightfully belongs to the fully free infographics tools. The Free plan gives you unlimited access to all layouts and graphics library, but you can only download three infographics per month. The paid Pro plan for $10 per month (subject to an annual subscription) provides you with access to all the features of the service and an unlimited number of downloads of created designs. The $20/month Team plan adds collaboration features that let you create and edit infographics with a group of up to five people.
Visme
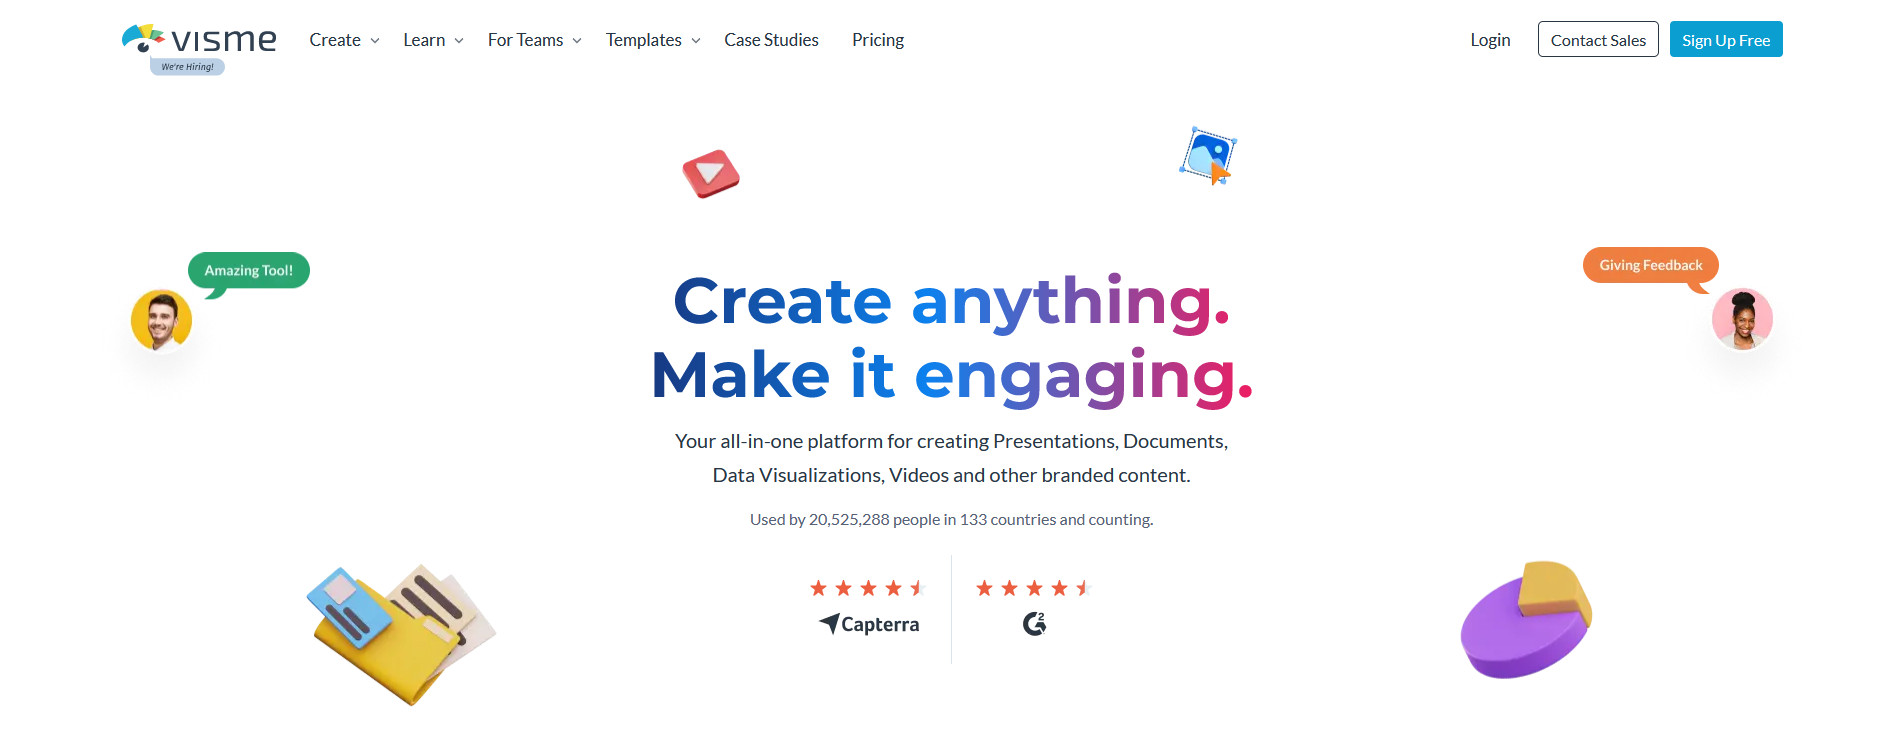
The Visme platform is deservedly included in the selection of free online data visualization tools. It is best suited for marketers who need a versatile all-in-one graphics editor with a focus on animation and animated infographics. In addition, it can be used to create presentations, mockups, banners, and other graphic products.
Key features:
- Over 1000 content blocks and infographic templates, 1.5 million hi-res images and 125 fonts, 50+ graphs, charts, and maps.
- The block editor allows you to flexibly modify and customize content blocks. This simplifies and speeds up the infographic editing process. In addition, it is allowed to add new design blocks and customize them.
- Visme allows you to develop static and dynamic infographics based on animated design layouts.
- There are many free stock images, videos, shapes, icons, illustrations, and animated characters available in the library. You can also embed content from external sources, such as YouTube, JotForms, and others.
- The Graph Engine module contains a number of graph formats, allowing you to import data from Excel or Google Charts. Infographic design tools in the Map Engine module help to create interactive maps, Flowchart Maker – charts, Table Maker – tables. Using the Apps module, you can connect to Google Analytics data.
The free Basic plan offers a limited set of templates and content, as well as up to 100 MB of space for uploading third-party images. The Starter plan for $12.25 per month provides you with access to all templates and content, the ability to download infographics in JPG, PNG, PDF, and 250 MB of space. The Pro plan, for $24.75 per month, provides 3 GB of storage and a number of additional features. The Visme for Teams enterprise plan is available on an individual basis.
Piktochart
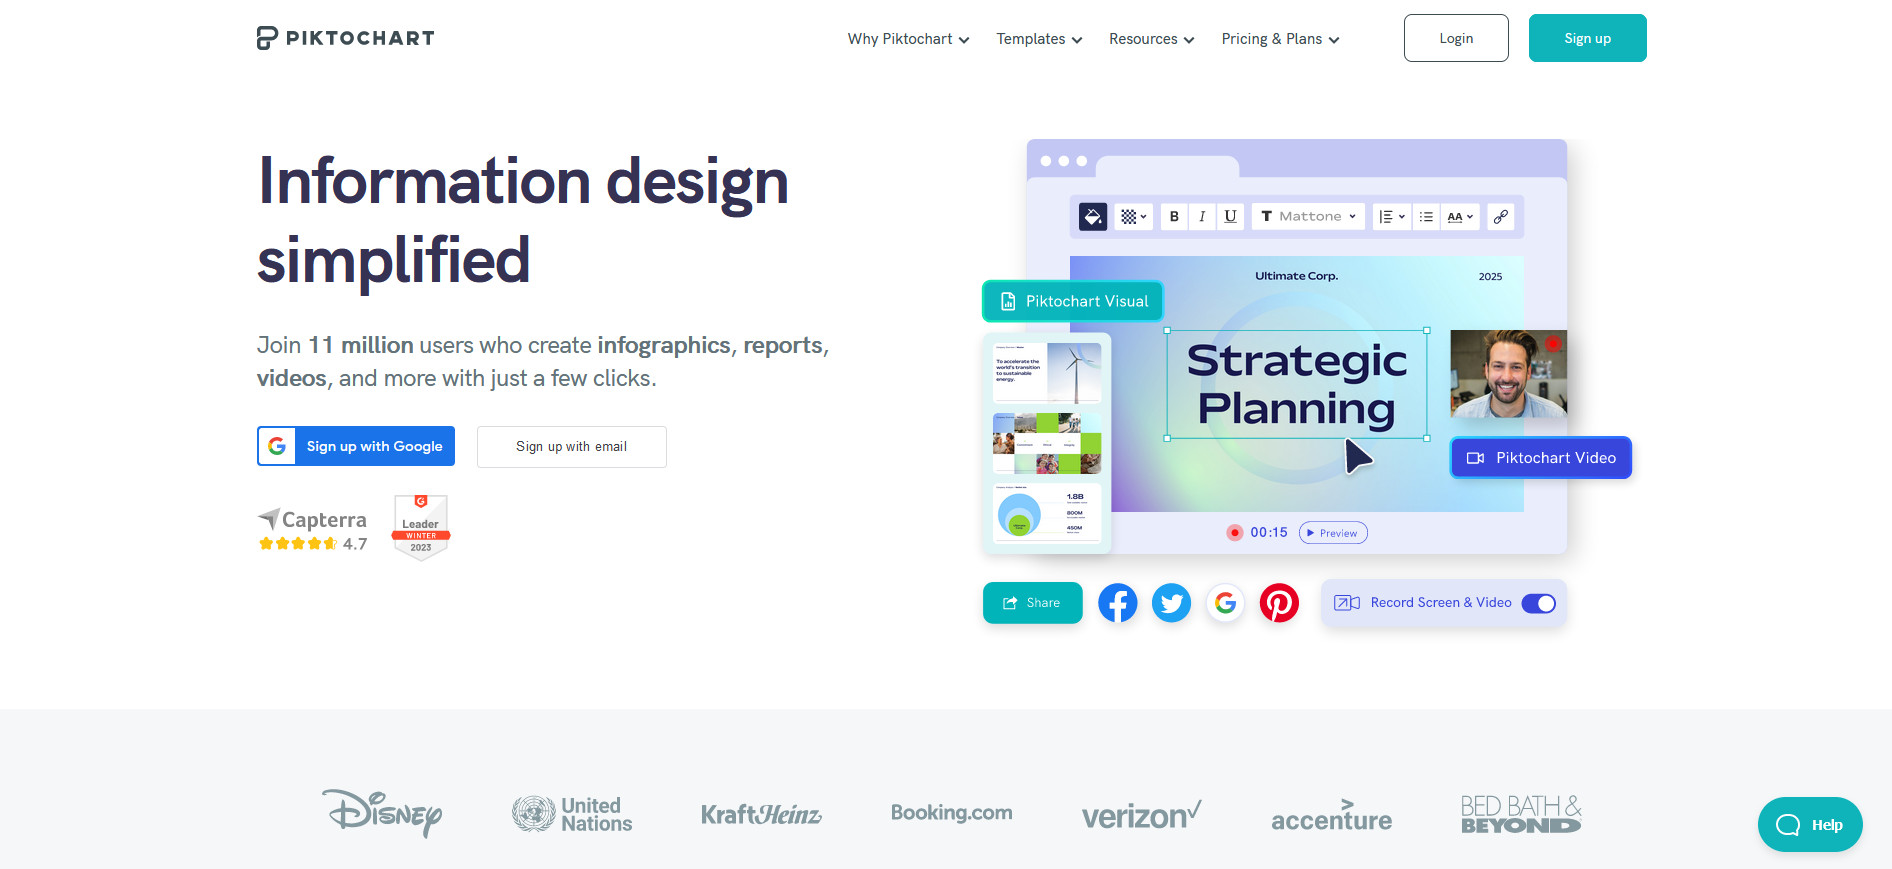
Piktochart is one of the best infographics tools for beginners who want to create professionally designed infographics without any special skills or additional tools. The service is aimed at entrepreneurs, marketers, and all those who need to communicate effectively with customers, investors, and business partners.
Key features:
- Over 600 highly customizable design templates and layouts for different types of infographics, maps, and interactive charts. It is possible to choose the appropriate design format: a classic infographic, a presentation with a slide gallery, a poster, or a report.
- A convenient drag-and-drop constructor allows you to create a design from scratch or edit a ready-made template by adding or changing graphics and text. You can also upload images from external sources.
- The catalog contains more than 4000 icons and illustrations. In some of them, you can change the color palette.
- Piktochart online data visualization tools offer 15 different types of interactive charts and a map. Users have the option to add data to them manually or import it from CSV or Google Sheets. In addition to standard charts, there are radial and hierarchical ones.
- Content blocks are customizable. It is allowed to change their background, size, and location on the layout.
- The created content can be exported in PNG, PDF, or PPT formats.
The free plan provides basic service features and a limited number of templates from the library. The Piktochart Pro plan for professionals and small teams, which opens up all the possibilities, costs $14 per month for one user. The price of the Enterprise corporate tariff for teams with 25 or more participants is calculated individually.
Infogram
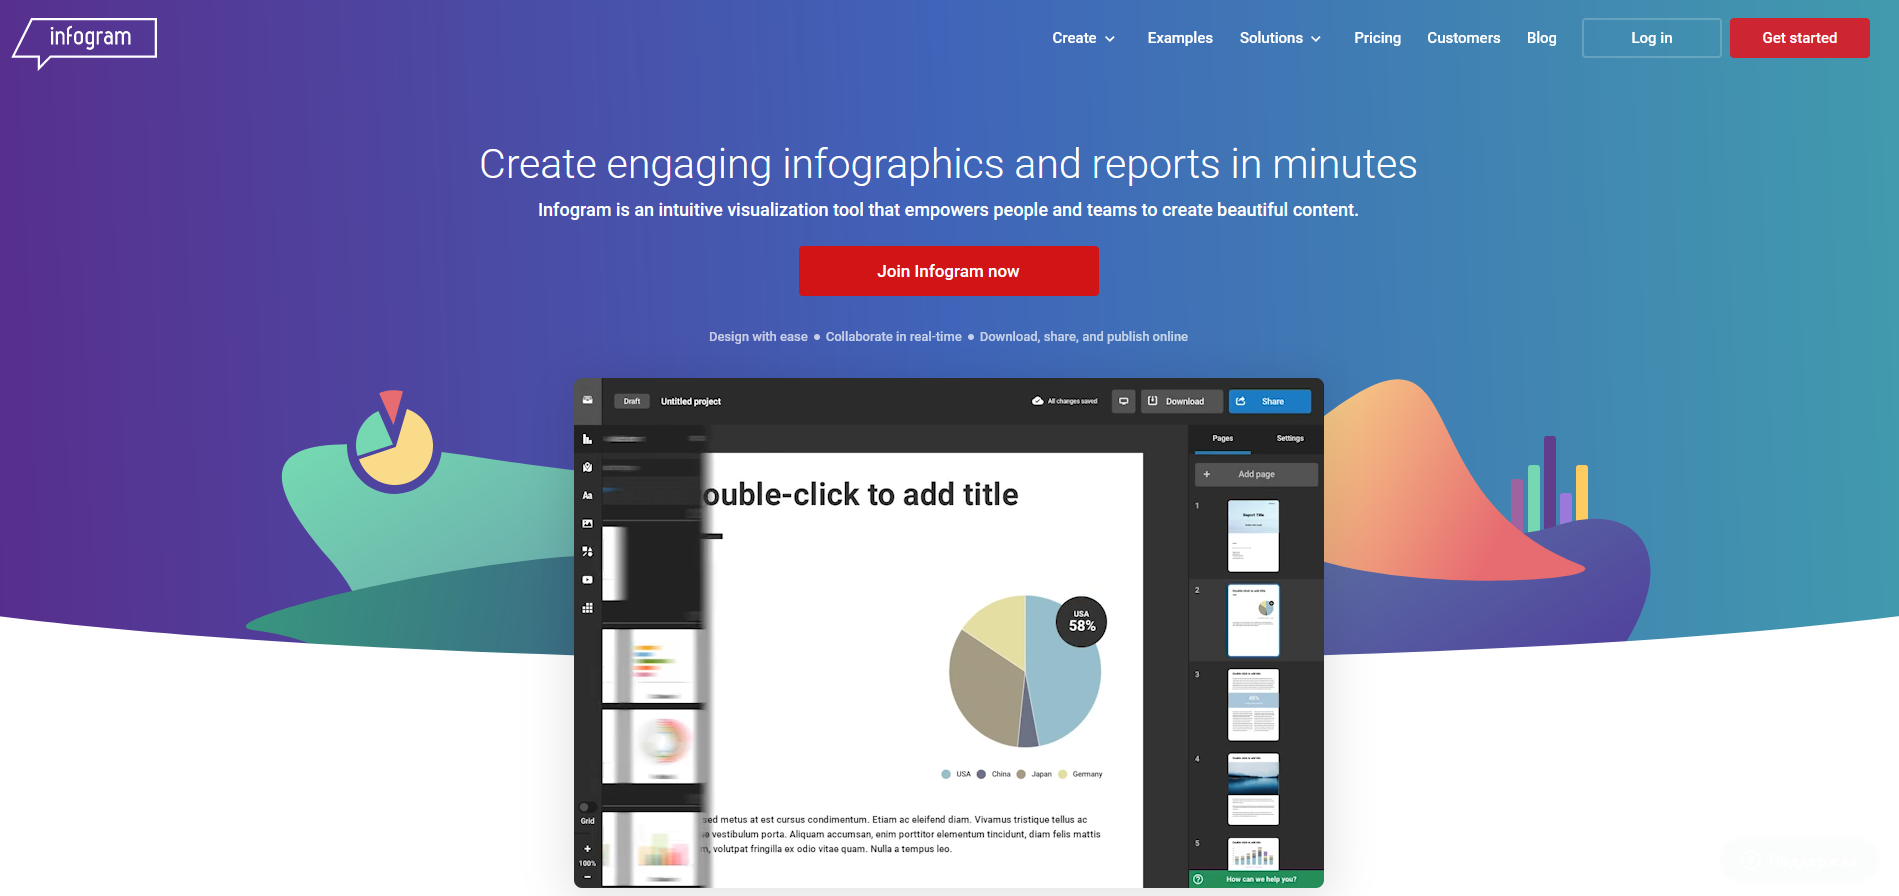
The Infogram platform completes our collection of top infographic software. It is ideal for users who need to visualize complex and large datasets. The service allows you to create slideshows, generate reports, and embed sales figures into your infographics.
Key features:
- Over 100 pre-made design templates, 40+ interactive charts, 25 icons, and 550+ maps. The catalog contains icons from The Noun Project, GIFs, and stickers from GIPHY.
- Users can create infographics online flexibly by adding various types of graphs and charts from the built-in library. Basically, tree diagrams and word clouds are available here. Manual data import from SQL databases and CSV files is available. Text editing features include changing the font of headings, plain text, and text in tables.
- The Infogram editor allows you to change the styles of content blocks. The most popular are flowcharts, timelines, and diagrams.
The free version allows you to create up to 10 projects and includes 13 different types of maps, but it does not allow you to download or distribute ready-made infographics. The paid Pro plan for $19/month provides premium templates and images, allowing you to create up to 100 projects with a 10-page limit per project. With the Business plan for $67 per month, users can create up to 1,000 projects of unlimited size as well as add their own logos, fonts, colors, and images. The Team plan for $149 per month gives you all the features of the Business plan, including advanced analytics and collaboration tools.
Conclusion
As you can see, each infographic software program described by us has its own differences and features. Most of the services are designed for beginners who do not have any design skills and do not want to learn specialized software. Almost all the platforms presented in our article offer many design templates for different types of infographics. Most of them are available from Adobe Express (10,000+), Venngage (7500+), and Snappa (6000+). Visme has an impressive set of tools and even allows you to create animated infographics. All the top 7 services provide free versions with reduced functionality, and the cheapest paid plan available from Adobe Express and Snappa costs as little as $10 per month.
If you use Facebook Lead Ads, then you should know what it means to regularly download CSV files and transfer data to various support services. How many times a day do you check for new leads in your ad account? How often do you transfer data to a CRM system, task manager, email service or Google Sheets? Try using the SaveMyLeads online connector. This is a no-code tool with which anyone can set up integrations for Facebook. Spend just a few minutes and you will receive real-time notifications in the messenger about new leads. Another 5-10 minutes of work in SML, and the data from the FB advertising account will be automatically transferred to the CRM system or Email service. The SaveMyLeads system will do the routine work for you, and you will surely like it.
