In this review, we will tell you about free online services that can help you to create high-quality infographics with your own hands for any purpose.
Content:
1. What are infographics?
2. Application of infographics
3. Who creates infographics?
4. The 7 best free online infographic makers
5. Conclusion. Everyone can create infographics
Infographics are an effective way of presenting visual information. It makes it possible very easy to convey even the most complex data to the users. You don't need to make long websites with dozens of screens with them. Multilevel diagrams fit into one screen, and you don't need to be a professional designer to create such illustrations.
We have selected free services for creating infographics online, but first, we will tell you what data visualization type it is and what it is for.
What are infographics?
Infographics are a graphical way of presenting material with the help of pictures in the form of chains and sequences, complex work schemes, interactions, and technical processes. In simple words, we use infographics instead of a complex and nuanced text when we need to explain specific things or processes.
The usual graphic materials: pictures and images can be a part of infographics. They simply reflect the essence of a phenomenon or object (for example, an arrow, a block, a diagram). On the other hand, infographics most often have text accompanying the picture, if the meaning is not clear from the context of the image. So, if we want to present information visually, without a text - this is what infographics for.
Application of infographics
Today, infographics are used in all types of online projects. It allows you to reduce the text amount on the web pages or social networks and simply and clearly explain the schemes and chains of interaction, processes.
You can see the infographics in the sections "How we work", "How to place an order", "Our advantages", and so on. It is used on social networks in the design of group headers and posts. It significantly simplifies the content perception, makes it simpler and understandable.
Infographics on the Internet take origins from school textbooks and student manuals. Remember the visual diagrams on the blackboard, textbooks, and presentations.
Who creates infographics?
To create infographics - the unique pictures that reflect the essence of phenomena and objects is the job of graphic designers. But if you do not want to spend money on creating each image and strive to learn how to do it yourself, in order to master this process in the future, or you just need simple illustrations, here is a list of free online services for creating infographics that allow you to try your hand.
The 7 best free online infographic makers
Сreately
Сreately is an online graphic editor for scheme and diagram creation.
The service provides users with a choice of dozens of different chart types. You can create flowcharts, models of various business processes, diagrams, UML, and site layouts.
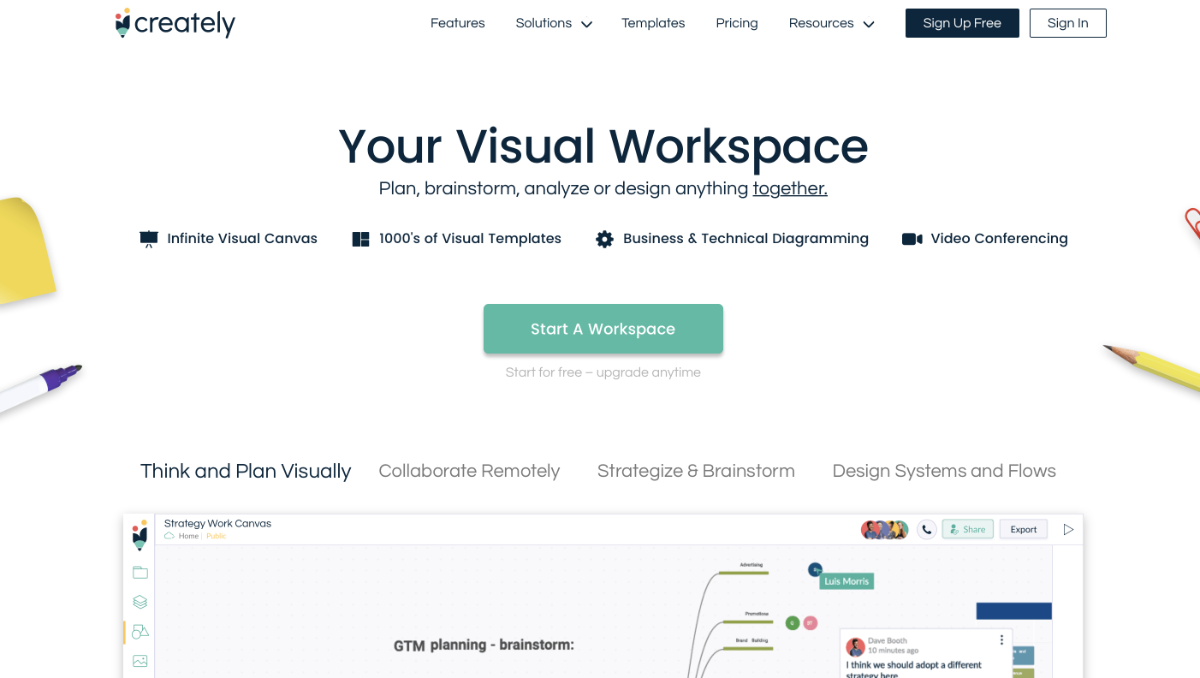
There is also an online teamwork option but this feature is paid. The constructor allows you to create diagrams by dragging and dropping blocks. The service has a wide range of functions, consisting of many tools.
Infogr.am
Infogr.am is another online service for creating infographics. It has preset templates for easy editing of your tasks and sufficient functionality. You can add graphs, charts, pictures, text, individual titles, and quotes to the template.
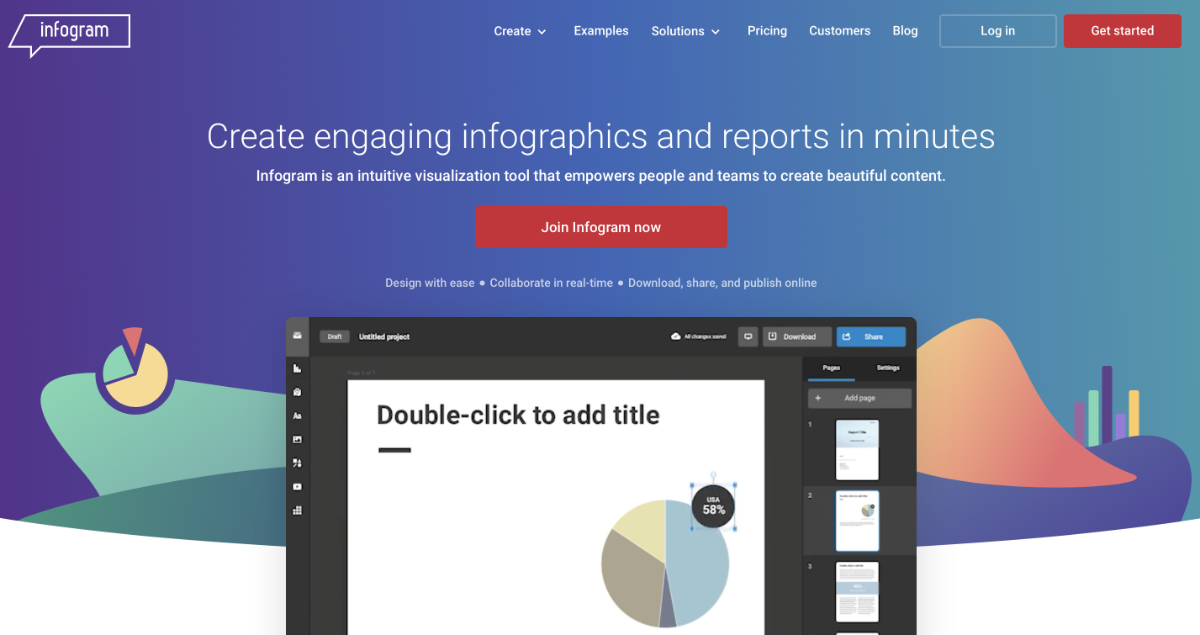
To use the service, you need to register or log in using your social network account. It allows you to store your designs and come back to edit them later.
Draw.io


Draw.io is a free service for creating flowcharts, prototypes, and other visual content. It will help you create UML models, graphs, and other visualization forms online. To work with the service, you can use your Google account.
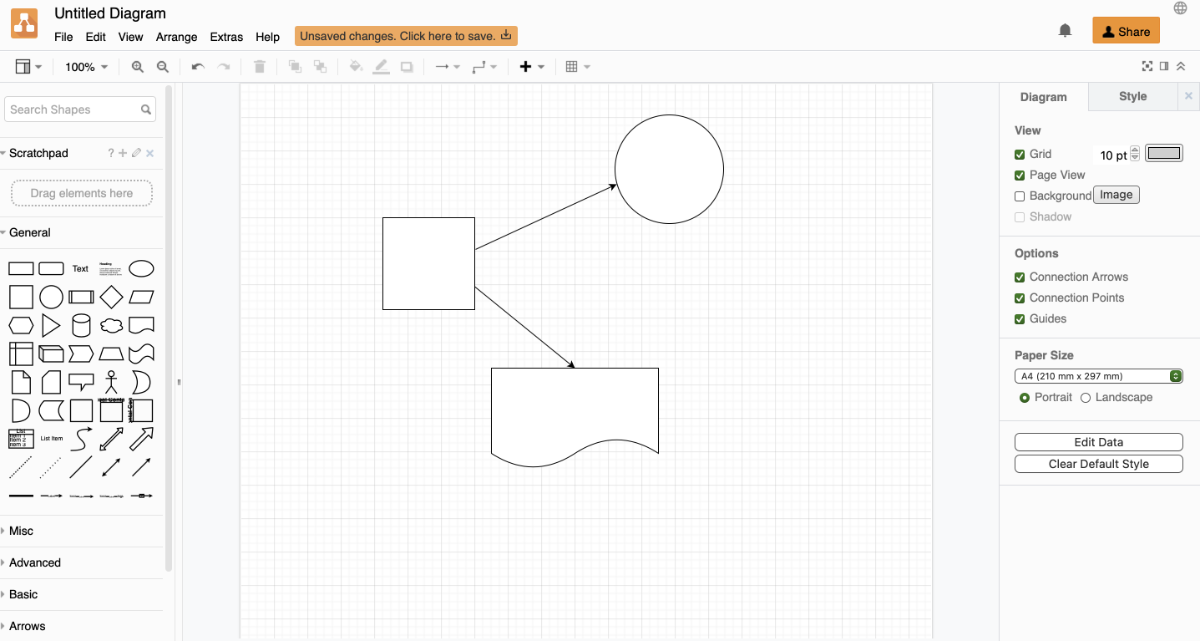
With Draw.io you can use flat and three-dimensional shapes, texts, headings, and various graphic elements. You can place them on a lined template where you can resize, color, or align them as you see fit.
Piktochart
Piktochart is a simple and user-friendly infographic tool. The service has three tariff plans, one of which is free. The paid ones, of course, have more features and functions. It also offers tooled options for the work of educational institutions and charity funds.
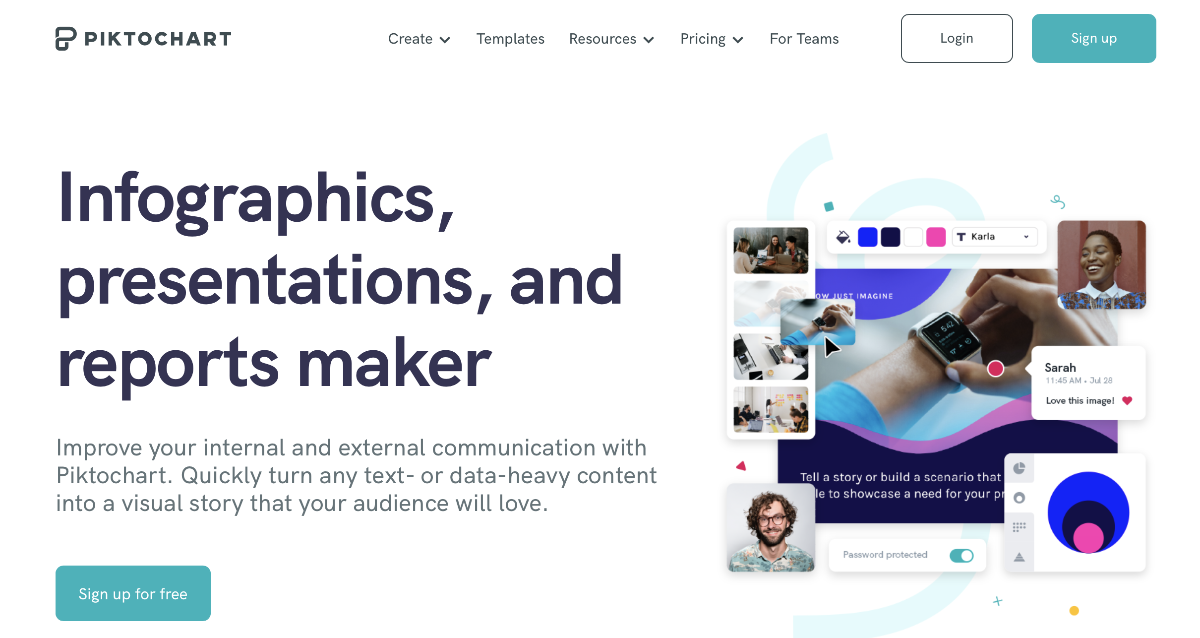
The free plan makes it possible to work with up to 5 projects, which is enough in most cases. The service has got a wide range of tools, including full-fledged work with fonts and texts.
Mind the Graph
Mind the Graph is a popular graphic editor used by research centers, scientists, educational institutions, academies because it has a complete toolset for creating infographics for any purpose.

The service provides more than 3000 premade templates that you can edit the way you want or create your own.
Visme.co
(visme.co)
Visme.co is a multifunctional service that allows you to create high-quality infographics. Moreover, it makes it possible to process videos, make animations, create a design, and design presentations.
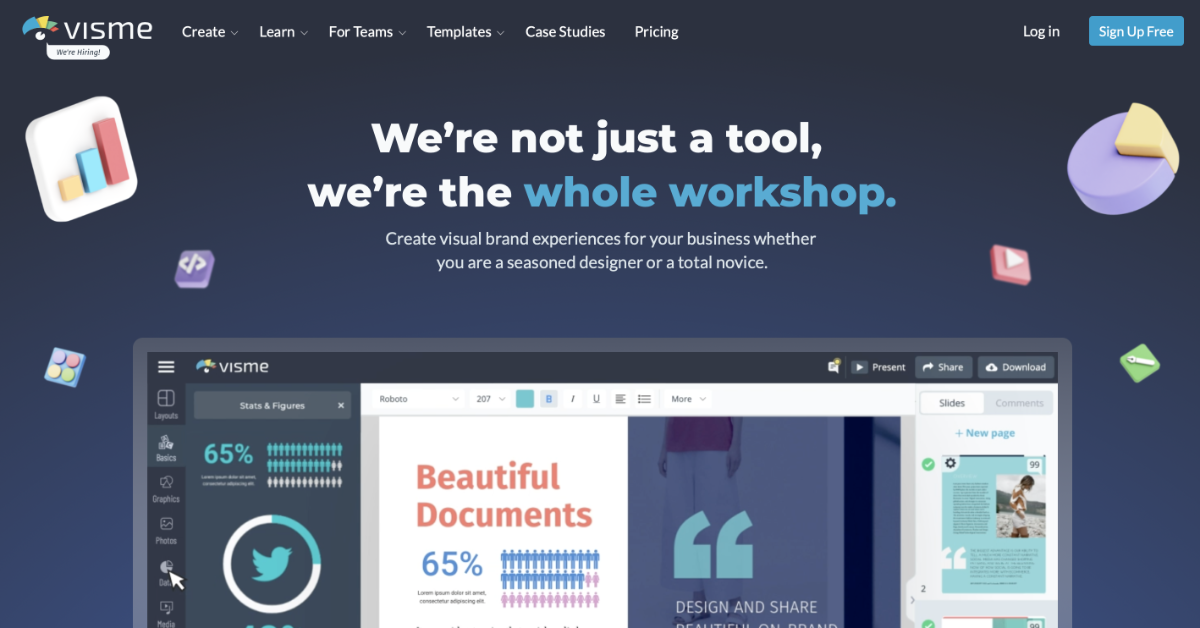
The basic functions are available free of charge. The optional functionality depends on the selected tariff. You can upload PDF documents, audio and video recordings, images, presentations and process them using the service.
DocHipo
DocHipo is a cloud-based document creation tool that you can use to design beautiful infographics. The graphic design application provides users with fully customizable Infographic templates for various use cases such as - business, dos and donts, facts, how to, process, tips, and travel.

Various design widgets and the drag-and-drop editor allow you to add text, pictures, and other graphic elements like illustrations, icons, shapes, etc., from DocHipo’s library to edit your infographic design the way you desire. Each data point in the templates is represented with blocks. You can edit or remove unnecessary blocks or create new ones easily if needed.
Conclusion. Everyone can create infographics
If you need to visualize the content, the infographics will help you to illustrate complex diagrams and instructions in a simple way. With our selection of online services and graphic editors, you can definitely choose the right service that will help you to visualize content, edit the necessary graphic materials, and make illustrations for blog posts and social networks.
If you deal in promoting a business on the Internet, you know that this work consists of many routine tasks like downloading leads from social networks to CRM, mailing delivery notifications to the customers, or transferring contacts to spreadsheets.
To save you from this routine work, we have created SaveMyLeads – the online connector that allows you to automate lots of business tasks. It does not take a lot of time and you do not need to be a programmer. All you need is to register on the website, select and connect the necessary social network services. After that SaveMyLeads will take over the routine work, and you will be able to spend time on more important tasks. Try it – there is nothing difficult about it!
